Math tools that recompute price and volume into lines and signals on a chart, trading indicators come in useful and useless kinds. Some genuinely help: gauging volatility, sizing a stop, spotting a big player's activity. But most popular oscillators lag, and their buy-sell signals over a long run work close to chance. So I keep the useful tools and have dropped the lagging signals from my own trading.
When I first came into trading, I started exactly like almost everyone: with indicators. They are easy to put on a chart, every book explains them clearly, and it feels like here it is, the entry button. After a few years of experiments I dropped them, keeping only volume, and behind that sits a simple mechanism worth understanding once. Let's calmly go through how an indicator is built, why the stochastic and MACD lag, what divergence is, and what I look at instead of their signals.
In this article we'll cover:
- an indicator is computed from past prices, so by nature it reacts after the move, not before it;
- oscillators like the stochastic and moving-average crossovers run close to a coin flip over a long series;
- divergence is a hint of a weakening impulse, but on an indicator it lags and in a trend it deceives;
- in my experience volume and volatility are what help, because they show the cause, not the trace of price.
Let's start with how an indicator is even built inside.
What Are Trading Indicators and Why Do They Lag?
A trading indicator is a formula that takes past prices and volumes over a chosen period and turns them into a line, a histogram, or a number on the chart. The key word here is past: any calculation leans on candles that have already closed, so by its nature an indicator shows what the market has already done.
By the task they solve, it is convenient to split them into groups. Trend ones show direction: moving averages, ADX, parabolic. An oscillator is a type of indicator that looks for extreme states, overbought and oversold: RSI, the stochastic, and CCI belong here. Volume ones gauge participant activity: Volume and OBV. Volatility indicators measure the size of the move: ATR and Bollinger Bands. That is the whole zoo a beginner sees in the terminal list. The heavier tools beginners pin special hopes on belong here too: the Ichimoku cloud, Elliott waves, and Fibonacci levels. They all lie nicely on history but give no edge without volume and context, and I pass the same verdict on the fashionable artificial intelligence in trading, since any model learns on the past and stays, in essence, one more lagging predictor. Now about the lag: it is not a flaw of a particular indicator, it is its property. A moving average averages price over the last N bars, and while the slow average is only thinking about turning, price has long since left. Expecting such a tool to predict the future is pointless: it honestly describes the past, and that is its ceiling. The general nature of indicators in trading I go through in more detail in the course section.
In short: An indicator is a formula built from past closed candles, so by nature it shows what the market has already done; the lag is not a settings defect but a property, and the ceiling of an indicator is describing the past.
Stochastic, MACD, and Moving Averages: Do the Signals Actually Work?
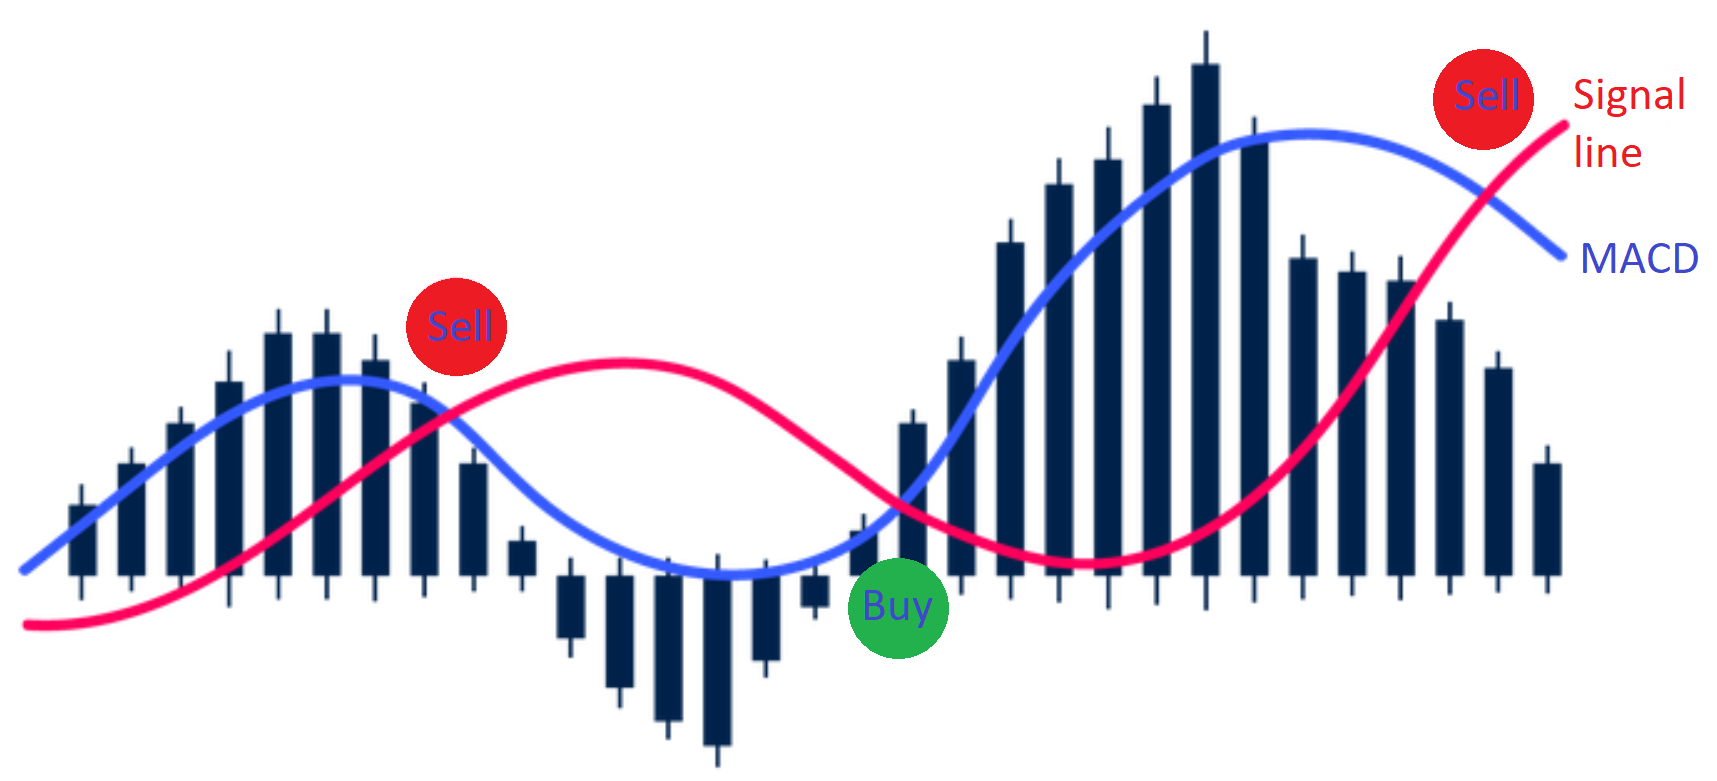
Let's take the three most common tools almost every beginner passes through. Moving averages, or movings, are averaged price over a period, and entry signals are built on their crossover. MACD is calculated as the difference of a fast and a slow exponential average with periods 12 and 26, plus a signal line over 9 periods. The stochastic compares the current close with the price range over a period and swings from 0 to 100.
Next I will speak from my practice, and this is precisely my position, not a proven law of the market. On the first trades such signals often feel like they work, and yes, sometimes a crossover really does catch a good low under a level, I traded that way myself when I started. But over a series of a hundred and three hundred trades the result comes out roughly like a coin flip: the indicator is wrong more often than it is right, while spread and commission slowly eat into the account. The point is not that the signal never works, it is that it has no durable edge. Add to that a frequent paradox: the stochastic shouts buy while the moving average at the same time says sell, and the trader freezes in a stupor. I am not calling to throw these tools out entirely, I just do not build an entry on them. Instead of a line crossover I look at where the level is, whether confirming volume is coming, how price behaves at that level, and then the same stochastic turns from a signal generator into a modest hint about the state of the market.
In short: Crossovers of the stochastic, MACD, and movings feel like they work on the first trades, but over a hundred to three hundred trades they come out like a coin flip with no durable edge; I do not build an entry on them, I look at the level and volume.
What Is Divergence and How Does It Look on a Chart?
Divergence is a disagreement between the movement of price and the readings of an indicator, when price sets a new high or low and the indicator no longer confirms that extreme. The mechanics: oscillators like RSI or the stochastic measure not price itself but the speed of its change, the momentum. While the trend is healthy, price and the indicator move side by side, and when the move runs out of steam, price still creeps the old way by inertia while the indicator has already turned.
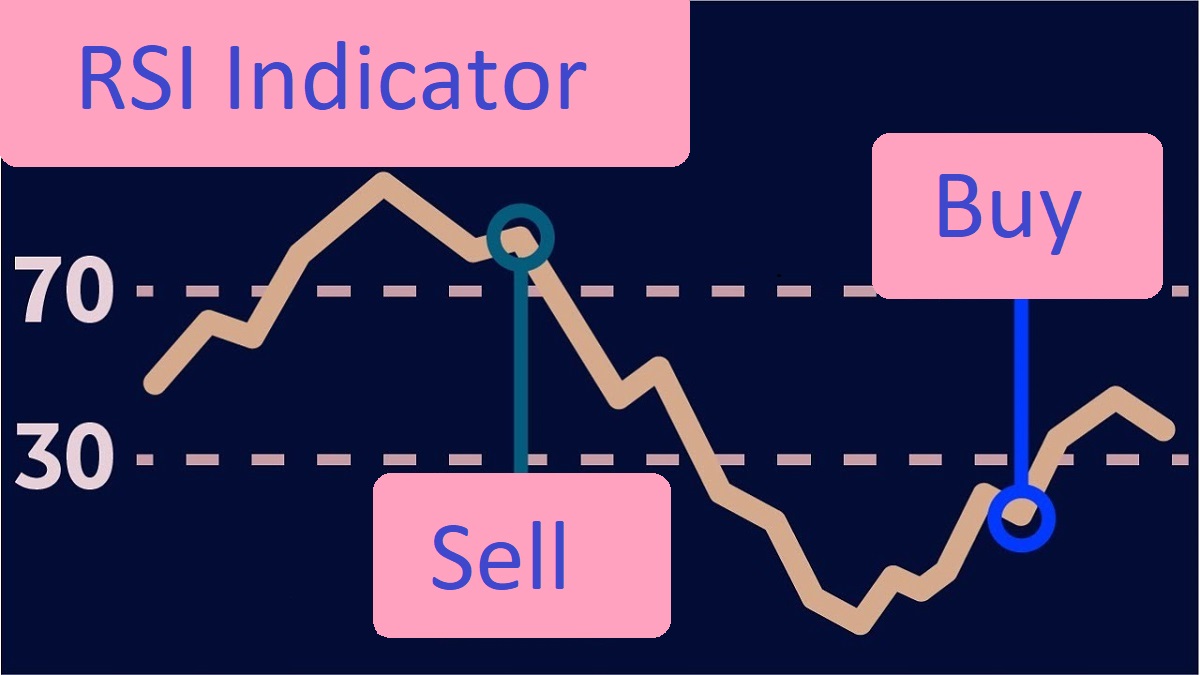
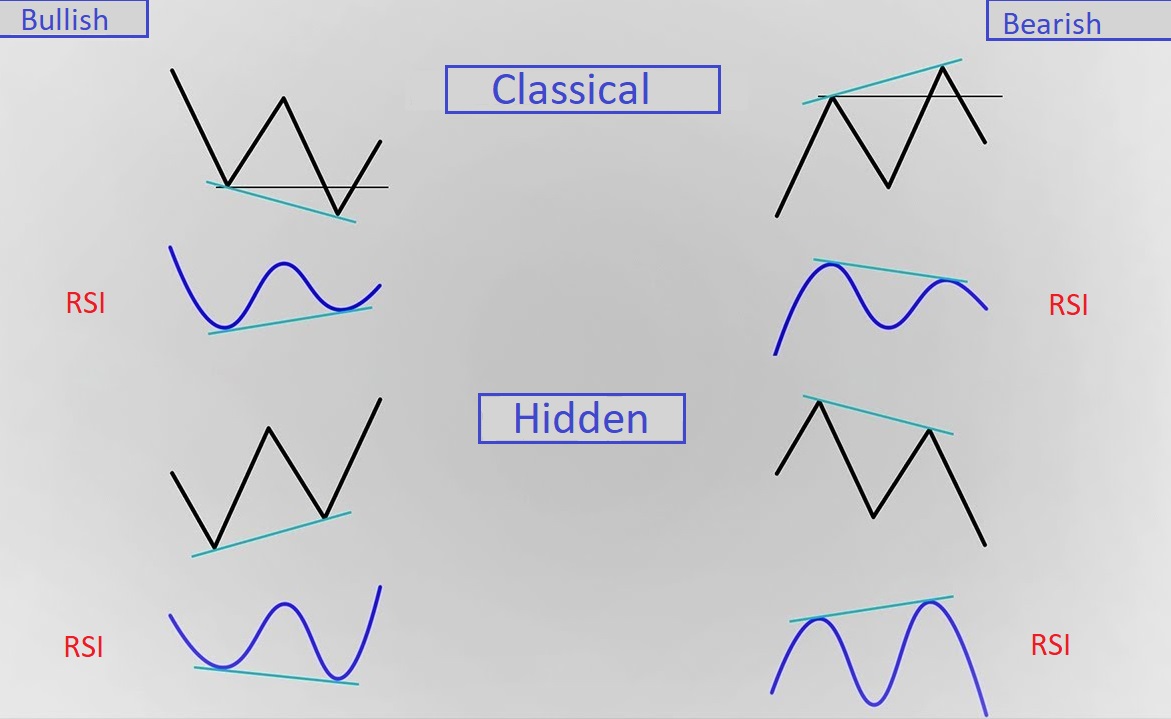
Ordinary divergence comes in two kinds. A bullish one appears on a fall: price draws a new, lower low while the indicator draws a low higher than the previous one, meaning sellers are pressing weaker than price suggests, and that is a hint of a turn up. A bearish one is mirror: price makes a new high while the indicator makes a lower peak, buyers are running out of steam. There is also a hidden divergence, which on the contrary hints at a continuation of the trend. Most often the disagreement is looked for on RSI, where values above 70 are overbought and below 30 oversold, and in those extreme zones the signal is considered firmer, and on MACD through its histogram. But remember the word hint: the indicator here is derivative of price, it brings no new information from outside, it only recomputes differently what is already on the chart. How RSI is built inside I go through separately in the piece on the RSI indicator.
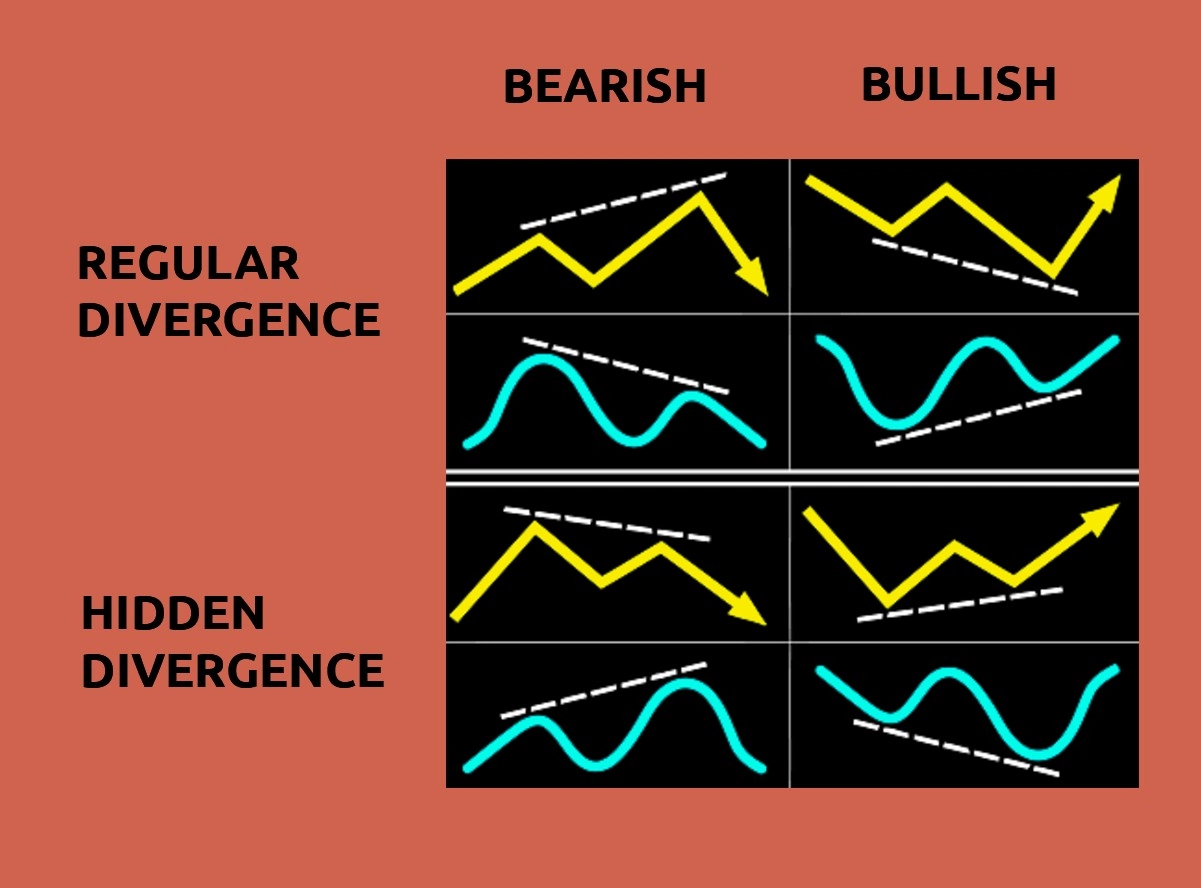
In short: Divergence is a disagreement of price and an indicator: price gives a new extreme while the indicator does not; bullish hints up, bearish down, hidden at continuation, but it is a hint of a weakening impulse, not an entry point.
Why Divergence on an Indicator Deceives You
Divergence shows only the weakness of the current move, not an entry point, and that is its subtle spot. On its own it often appears long before a real turn, and in a strong trend it gives a series of false signals: price calmly goes on and shakes out the early buyers. Trading it blind means catching falling knives.
Let me show on an example how this looks in life. On the four-hour chart of gold price makes a new low while RSI draws a higher low, a bullish divergence is in plain sight. The crowd buys at once, expecting a turn. I do not enter the market on this alone: I wait until price comes up to a strong level and a reversal candle appears there with a burst of volume. If there is no volume, the divergence stays a pretty picture while price goes lower. Divergence says maybe, and the decision I make by the level and volume. And here is my main takeaway on this topic: it is more honest to look at the disagreement of price not with an oscillator but with volume. When price crawls to a new low while volume on that move falls, that is the real weakness, visible by the cause and not by a derivative of price. It is the same logic of effort and result: no volume, no trust in the move.
In short: On an indicator divergence lags and in a strong trend gives false signals; on gold 4H I do not enter on divergence alone, I wait for the level, a reversal candle, and volume, and it is more honest to look at the disagreement of price with volume rather than with an oscillator.
Which Indicators Are Actually Useful: Volume and Volatility
So what out of all this zoo did I keep? Two classes of tools help, and both show the cause, not the trace. The first is volume indicators: volume is the imprint of real participant activity, by it you can see whether big capital came into a point or price is being pushed by emptiness. The second is volatility meters like ATR, which is convenient to use for sizing the stop width and the position, not as an entry signal.
The difference is fundamental. A lagging oscillator is a derivative of price, by definition it catches up to the market rather than forecasting it: it waited for the bar to form, recomputed by the formula, gave a signal, and you are already late. Volume, on the other hand, shows the very effort that moves price, so I build the decision on levels and volume, while an indicator at best complements the picture but never replaces an understanding of supply and demand. The volume approach versus the indicator one I go through in detail in the piece on volume analysis, and how ATR helps to dose risk, in the piece on the ATR indicator. This is not a call to delete every indicator from the chart, it is my honest conclusion over the years: look not for the perfect indicator but for the cause of the move. Why I dropped indicators and what I use instead I show on a chart in the video: why indicators lag.
In short: Volume and volatility (ATR) are useful, because they show the cause, not the trace; an oscillator by definition catches up to the market, so I build the decision on levels and volume, while an indicator only complements but never replaces an understanding of supply and demand.
How indicators fit into a whole reading of the chart I go through in a separate piece.
Frequently Asked Questions
Because any indicator is computed from already-closed candles, that is from past prices. By its nature it shows what the market has already done, not what will be. The lag is not a settings defect but a property of the tool itself, and its ceiling is describing the past.
On the first trades crossovers often feel like they work, but over a series of hundreds of trades their result is roughly like a coin flip: there is no durable edge, while spread and commission slowly eat into the account. I do not build an entry on them, I look at the level and volume.
A disagreement between price and an indicator: price renews an extreme while the indicator no longer does. A bullish one appears on a fall and hints at a turn up, a bearish one is mirror. But it is only a hint of a weakening impulse, not a ready entry point.
Because on an indicator it lags and in a strong trend gives a series of false signals: price calmly goes on and shakes out the early buyers. It is more honest to look at the disagreement of price and volume, and to make the decision by a strong level and a reversal candle.
In my experience volume indicators and volatility meters like ATR are useful, because they show the cause of the move, not the trace of price. Lagging oscillators as a signal generator I do not use in my trading, I kept only volume.
About the Author
Author: Igor Arapov — independent researcher in the psychology of investment decisions and behavioral finance, practising trader since 2013, founder of arapov.trade, author of a trading book series (ORCID: 0009-0003-0430-778X).