The Wyckoff method is a way to read the market through volume and price so as to see the actions of large capital. It splits the chart into recurring phases: accumulation, markup, distribution, and markdown. The trader's job is to work out which phase the market is in now and to stand on the side of those who actually move the price.
When a beginner opens a chart, he sees chaos: the price now stalls, now lurches, catches stops and reverses. Wyckoff offers a different lens. Behind that chaos sits the logic of large players, and it leaves traces in volume and in the behavior of price. The method does not predict the future. It shows who is building a position and who is handing it out, and where in that picture the price sits right now. At the end I will say separately why I trade only by this method and where it has its limits.
In this article we'll cover:
- the market under Wyckoff is moved by large capital, and its actions are read in volume and price, not in indicators;
- the market passes through four recurring phases: accumulation, markup, distribution, and markdown;
- the accumulation phase is given away by a range after a decline, fading volume, and a false breakdown down with a return into the range;
- the method is clearer where volume is reliable: stronger on futures and crypto than on classic forex.
What the Wyckoff method is and how it works
The Wyckoff method is a system of market analysis through volume and price that describes the actions of large participants and divides the market into recurring phases of accumulation and distribution. A retail trader does not guess the direction but works out the actions of large capital and joins them.
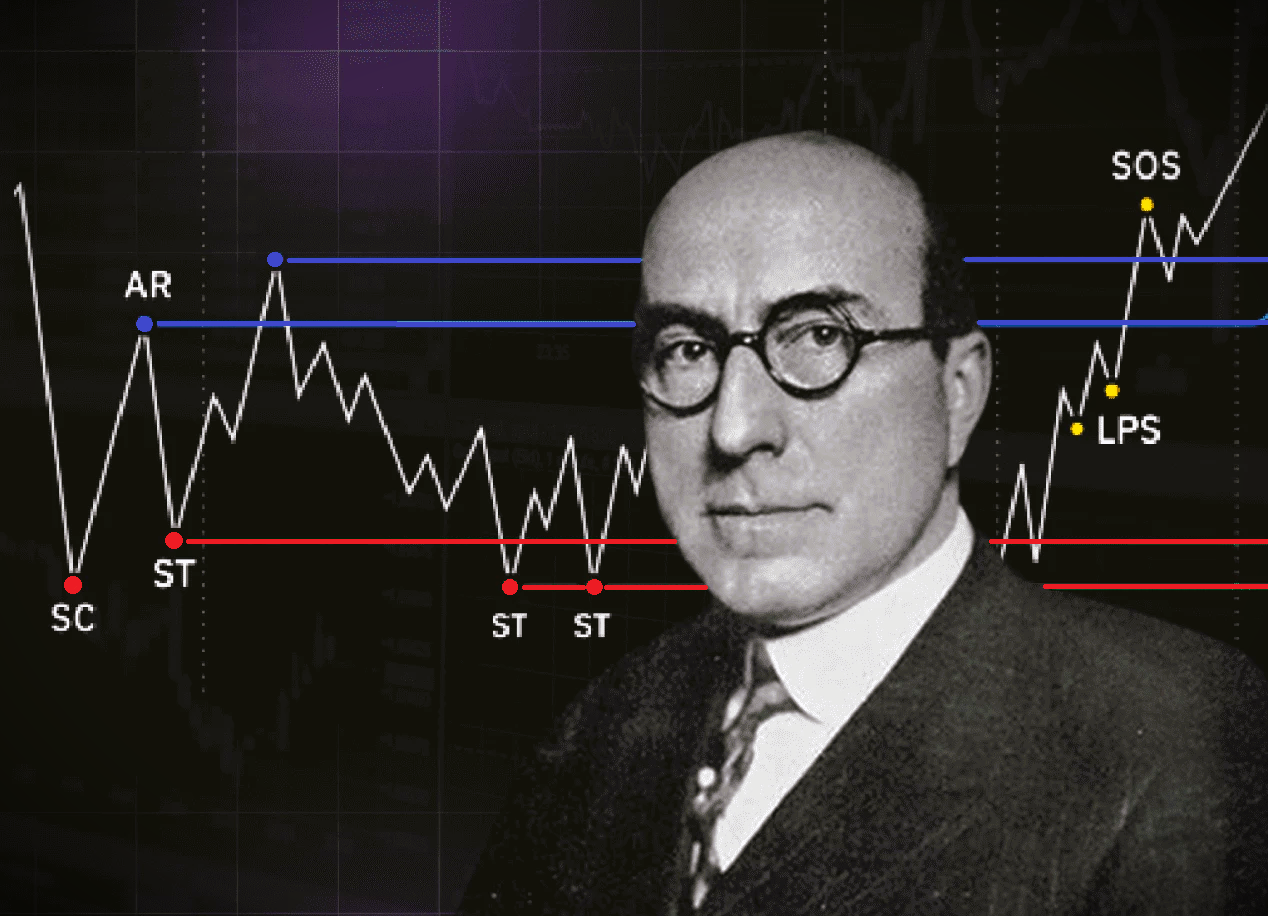
Richard Wyckoff was an American trader and publisher who watched the exchange from the late nineteenth century and shaped his method in the first third of the twentieth. The main thing he noticed: there are participants on the market who earn steadily, and their actions are not random. More than a hundred years have passed since, forex, futures, and cryptocurrencies have appeared, yet the logic of the market has stayed the same.
Wyckoff split the market into two categories. The first is large capital: banks, funds, professionals who understand the real value of an asset and operate in big volumes. The second is the mass of retail participants, who act on emotion, on indicators or chart patterns, and often become the side of the trade on which the first ones earn. Wyckoff's name for these large players was the Composite Man, also rendered as the Composite Operator. A phrase captures the gist well: big money pays the price and receives the value. They buy where it is cheap for them and sell dear. This logic is easier to grasp through the concept of Smart Money, which grew out of Wyckoff's ideas.
Who is the Composite Man in the Wyckoff method
Wyckoff asked traders to picture every large operator as a single figure, the Composite Man, who plans and runs each campaign on purpose rather than by accident. He accumulates quietly while the crowd sells in fear, marks the price up, then distributes into the optimism he has created. Reading a chart through his eyes turns the question from where price is going into what the large operator is doing right here. His clearest fingerprints sit at the edges of a range: the spring that sweeps liquidity below support, and the test on lower volume that confirms supply is gone before the markup begins.
Beneath the method lie three laws of the market. The law of supply and demand: price goes where the force outweighs, until it runs into equilibrium. The law of cause and effect: the longer and larger the accumulation, the more powerful the subsequent trend. The law of effort and result: a large volume should give a proportional move in price, otherwise the effort is absorbed by the opposite side and the move runs out of breath. The third law is easiest to check by eye through volume analysis of the market.
In short: The Wyckoff method reads the market by volume and price so as to see the actions of large capital rather than guess; beneath it lie three laws: supply and demand, cause and effect, effort and result.
The Wyckoff market cycle phases: accumulation, markup, distribution, markdown
Large capital does not enter the market instantly: to build a position it needs sellers, and to exit it needs buyers. So it acts cyclically, and the whole cycle fits into four phases.
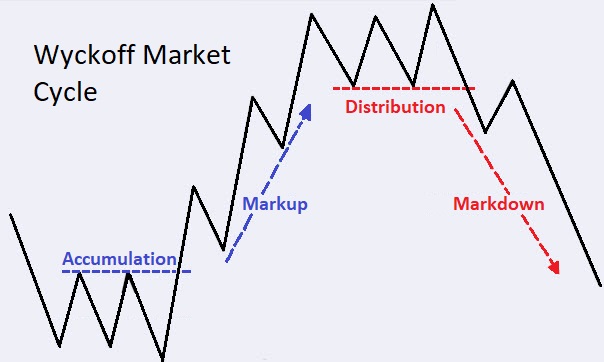
Accumulation is a long range after a decline. Large participants methodically buy the asset in portions, trying not to drive the price up. Outwardly it is a lull: the swing of the moves narrows, volumes fade. The crowd sells off while professionals calmly take the goods at a low price.
Markup, the growth phase, begins when the cheap supply in the range runs out and you can no longer buy the previous volume without shifting the price. The market goes up in steps. On moves along the trend the volume grows, on pullbacks it falls, and broken resistance becomes support.
Distribution is the mirror of accumulation at the top. After the rise the price again enters a range, but large capital is no longer buying; it quietly unloads positions onto an inspired crowd. Volumes are high, yet the price stops setting new highs. That is the first bell of a shift in initiative.
Markdown, the decline phase, closes the cycle. Price goes down in steps, each bounce below the previous high, volumes grow on the falls and fade on the rises. Then it all repeats: somewhere low, accumulation will start again. Determining the current phase is the main skill of the method, since which way to look depends on it.
In short: The Wyckoff cycle is four phases: accumulation (a range after a fall with fading volume), markup in steps, distribution at the top, and markdown; determining the current phase is the main skill of the method.
How to identify the accumulation phase on a chart
Accumulation almost always looks the same. First comes a decline, after which the price settles into a horizontal range. That is a signal that the fall has been stopped and someone has begun collecting the goods. Inside the range there are two signs: the candle spread narrows, volumes fade. Active selling thins out, there is almost no one left to sell.
The key moment is the spring. That is the name for a false breakdown of the lower edge of the range: the price dives under support, snags the stops of those who were buying, knocks them out of their positions, and immediately returns. This flush down is also called a shakeout or a false break. The point is one: large capital briefly pushes the price the uncomfortable way to gather liquidity, that is, the counter-orders it needs to enter. A return into the range on noticeable volume is a strong sign that accumulation is coming to an end.
Next comes the secondary test: the price approaches the spring zone once more, but now on lower volume, and does not break it, forming a higher low. There are no aggressive sellers, and after the first confident impulse up with volume expansion the accumulation phase is considered closed. How these zones look on a real chart is shown in the breakdown of where to look for the smart-money accumulation phase.
The main mistake here is haste: not every range after a fall turns into a rise. So the phase is not guessed in advance but waited out for confirmation: spring, return into the range, growth of volume up. To avoid confusing accumulation with an ordinary pause in a trend, it helps to keep the Wyckoff concept of volume in mind: without volume confirmation any breakout can turn out false.
So this does not stay general, let me lay accumulation out by sub-phases, the way it is meant to be read. Wyckoff himself split the range into stages from A to E, and inside runs a recognisable chain of events. Phase A stops the fall: preliminary support PS, then a selling climax SC at a volume peak and an automatic rally AR that outlines the top of the future range. Phase B is the accumulation proper, a long range where large capital quietly builds while price travels between the edges and makes secondary tests ST. Phase C is the test of strength: a spring, a false break below the low that collects stops, followed by a test on low volume. Phase D is buyer strength already: a sign of strength SOS carries price out of the range, and pullbacks to its upper edge form the last points of support LPS. Phase E is the exit into the markup. Distribution at the top is the mirror: instead of a spring an upthrust UTAD, instead of a sign of strength a sign of weakness SOW, and the supports are called LPSY. The market rarely draws the schematic perfectly, so I hold to the logic of effort and result under each bar rather than to the exact shape.
In short: Accumulation is given away by a range after a decline with narrowing candles and fading volume, and the key is the spring, a false break down with a return and a secondary test; the phase is not guessed but awaited through volume confirmation up.
The Wyckoff method for crypto and forex: practical application
The method is universal, but the quality of volume differs across markets, and that decides how much to trust it. The most honest data come from exchange futures, on the CME for example, where deals pass through clearing and are really executed. So a currency is more convenient to analyze not by spot forex, where there is no unified volume count, but by futures on the same pair. Reliable volume is the very foundation of analysis.
On the crypto market, Wyckoff patterns are often especially vivid: capital there is concentrated in a small number of large holders, and accumulation zones before strong moves stand out clearly. The flip side is that on small, low-liquidity coins the sharp flushes of price on anomalous volume are often artificial: a large participant creates the hype itself to draw in the crowd. Volume analysis helps to tell real accumulation from manipulation, but it demands caution.
In practice it makes sense to hold two timeframes: on the higher one you determine the phase and context, on the lower one you refine the entry point. When the signals of both intervals align, the probability of follow-through is higher. The approach itself is the same on any market; only the reliability of the volume at hand changes. I have traded volume analysis by Wyckoff for years and never found another method for myself: I started with books, indicators, and chart patterns, the first years can be written off, and only after studying with a practitioner did it all fall into place. The value of Wyckoff is that it removes the impossible task of guessing the future and shifts attention to those who influence it. Now about the limits of the method: volume analysis does not give a hundred-percent accuracy, clean textbook schematics turn up ever more rarely, and the market grows more complex, but the strength of the method opens up in combination with levels, since ultra-high volume at a level is information about where the interest of large capital was. On money separately, and this is not advice to you personally but how I act myself: the method is needed for a statistical edge, not an exact forecast, and a win rate of about 70 to 30 is already enough if you keep reward to risk around three to one and limit the risk per trade to a small share of the account. Then even a losing streak does not kill the account, and over the long run the math works for you, and how to count that I show in the section on risk per trade, while the logic of the phases I cover in the section on the Wyckoff method of the free course.
In short: The method is universal, but the reliability of volume decides it: most honest are CME futures, on forex a currency is read by its futures, on crypto the patterns are sharper but on small coins there is more manipulation; a win rate of about 70 to 30 with reward to risk of three to one already gives an edge.
Frequently Asked Questions
It is a way to read the market by volume and price so as to see the actions of large players. Knowing the current phase (accumulation, markup, distribution, or markdown), a trader stands on the side of large capital rather than against it.
A spring is a false breakdown below the lower edge of the range at the end of accumulation. Price dives under support, knocks out buyers' stops, gathers liquidity, and returns. A return into the range on rising volume confirms the market's readiness for a move up.
Four: accumulation, markup, distribution, and markdown. Each has its own signs in price structure and in volume.
You need a decline, after which price settles into a range with fading volume and a narrowing candle spread. Then a spring, a false break down with a quick return, followed by a secondary test on lower volume and an impulse up. Only this sequence confirms accumulation.
Yes, the logic of the phases is the same everywhere. On crypto the patterns show up vividly because of capital concentration, but on small coins there is more manipulation. On forex there is no unified volume count, so currencies are analyzed by exchange futures.
About the Author
Author: Igor Arapov — independent researcher in the psychology of investment decisions and behavioral finance, practising trader since 2013, founder of arapov.trade, author of a trading book series (ORCID: 0009-0003-0430-778X).