Price on an exchange is not someone's decree, it is the point where buyers and sellers meet right now. Supply and demand shape it, and you read that in the order book and in trade volume. Liquidity sits right beside it, the market's ability to swallow your order without rocking the price, and it is precisely the zones of liquidity that big capital hunts. Understanding all of this matters no less than reading the chart.
The subject looks like dull theory, yet it is the foundation, and without it you never catch why price moves the way it does. I trade CME futures and gold, and I look for the large player not in the flickering order figures but in the footprints he leaves in volume. Let's lay it out piece by piece: how price is born, what Bid and Ask actually are, where spread, liquidity and volatility come into it, and why the market maker is nothing like the villain he gets painted as.
In this article we'll cover:
- price is shaped by the balance of supply and demand, and the real imprint of the fight shows up in volume;
- Bid is the buyers' price, Ask the sellers' price, and between them sits the spread as a toll for entry;
- liquidity is the market's ability to absorb an order without moving price, and the zones where stops pile up are pools;
- in my experience the market maker does not hunt you personally, he collects liquidity where the crowd puts its stops.
We start with how price is born in the first place.
How price forms on an exchange: supply, demand and volume
Price is always an agreement between those who want to buy and those who want to sell. When buyers outnumber sellers and push harder, price climbs until enough sellers gather. When sellers are stronger, price slides down. That is how the balance of supply and demand works on any market, from stocks to futures, and on any time scale.
Plenty of forces move that balance: macro data and central-bank rates, corporate earnings, and on top of it the psychology of the crowd with its fear and greed, which breed now bursts of optimism, now panic sell-offs. But what matters to me is not guessing the cause, it is seeing the result on the chart. The cause can wait. The real imprint of the fight between buyers and sellers shows up in volume, and that is exactly what I read to tell who is actually holding the move, smart money or retail. Why volume, and not indicators, is the cause behind price, I unpack in the course section on volume analysis.
In short: Price is the agreement of supply and demand, not anyone's decision; you do not have to guess the cause, the result of the fight shows up in volume, where you see who holds the move.
The order book, Bid and Ask: how to read the book of orders
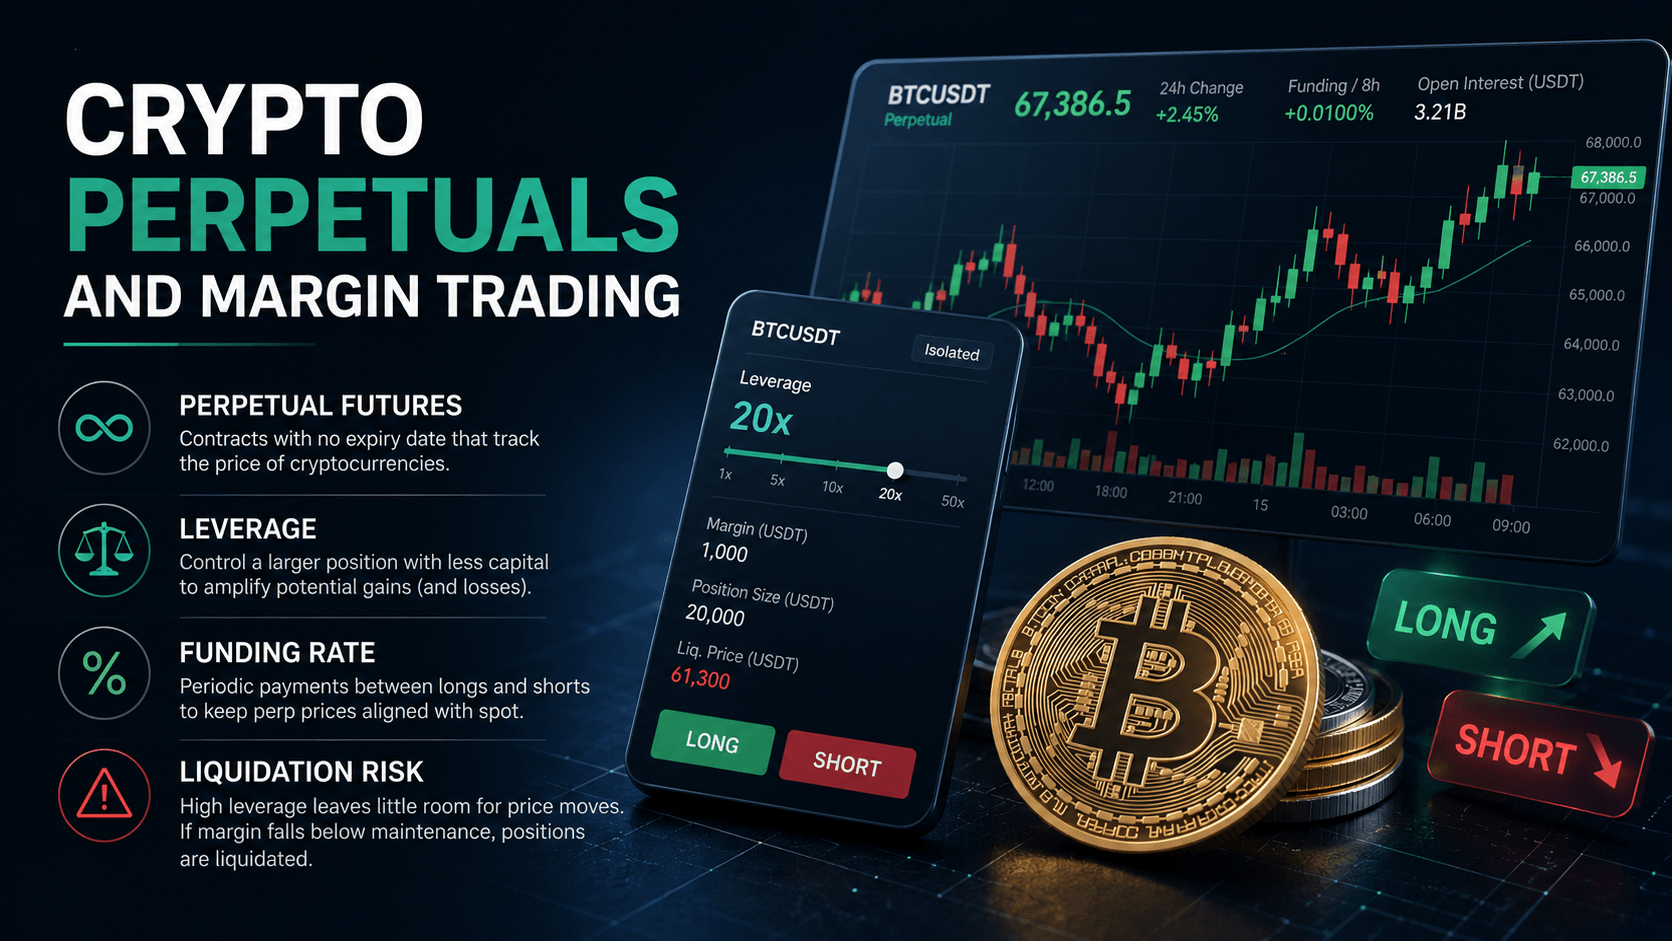
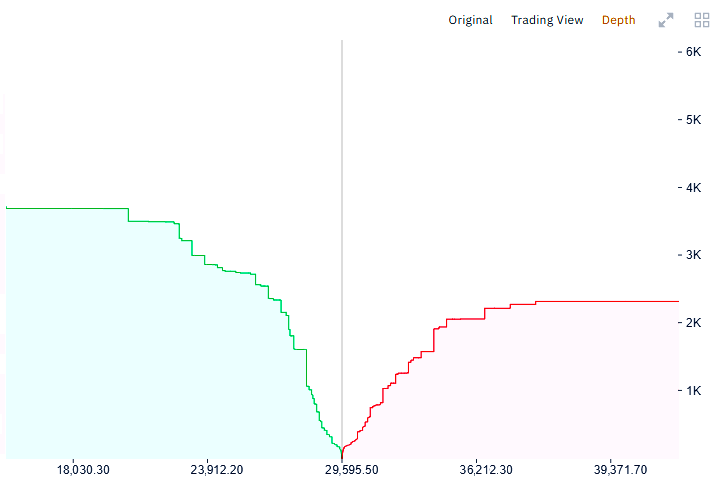
The Order book is a list of all live buy and sell orders for an asset, lined up by price; it also goes by the book of orders or depth of market. Buyers stand on one side, sellers on the other, and each line shows a price and the volume someone is ready to buy or sell.
At the finest level, price is set by two numbers. Bid is the best price someone agrees to buy at, Ask is the best price someone agrees to sell at, and the distance between them is the spread. Two kinds of order live in the book: a limit order waits for its price and stands in the queue, a market order fills at once at whatever price is there. When a flow of market orders chews through the limit orders on one side, price slides that way, and not smoothly but in steps, as the liquidity of the nearest levels gets eaten. Here is the thing to grasp right away: the book is a one-second slice, as if we froze the market, and in live trading those figures twitch non-stop. Often it is nearly empty, and then even an average market order drags price a long way, because there is simply nothing for it to lean on. So an empty book is a risk of sharp moves, not a sign of calm. The kinds and mechanics of orders, market and limit, I cover separately in the piece on order types.
In short: Bid is the best buy price, Ask the best sell price, and the spread sits between them; the book is a one-second snapshot, and an empty book is dangerous, since even an average order drags price when there is nothing to lean on.
Spread: the hidden cost on every trade
The Spread is the difference between the buy price (Ask) and the sell price (Bid) of one and the same asset at a given moment. You buy at the higher Ask and sell at the lower Bid, so the instant you open a trade you are already down by the spread, and price has to cross that gap in your favour just to get you back to break-even.
The key point is that the spread is not a one-off trifle but a cost that repeats on every single trade, and I treat it as part of the trade's maths. For someone holding a position for days, a single spread is almost invisible against the size of the move. For scalping, though, where there are dozens of trades a day and the target is a few points, the spread turns into the main enemy. A plain example: at a three-point spread every trade starts three points in the red, and for a scalper chasing five to ten points that is a huge share of the target, while for someone taking hundreds of points it is loose change. The practical conclusion follows: the larger your target, the smaller the spread's share of the result, which is why calm trading off levels is almost always cheaper on costs than fuss on the one-minute chart. The size of the spread depends on liquidity: on popular pairs in active hours it is tight, around a point, while on exotics or in the moment of news it can jump to tens of points. And one more thing about the advertised zero spread: free it never is, the broker simply charges another way, usually a commission per trade, so you compare conditions across all costs at once. This is not advice aimed at you, it is how I count costs: it is cheaper to trade less often and more precisely than often and on emotion.
A second cost is often confused with the spread, and it pays to separate them. The spread is a constant, known-in-advance gap between Bid and Ask. Slippage is different: the gap between the price you expected at the moment of the click and the price at which the order actually filled. It is born when a market order does not find enough opposing limits at the wanted price and eats the book in steps higher or lower. So slippage is not constant like the spread, it flares where the book is thin: on exotics, at the moment of news, on large size and almost always on a market order. A limit order from a level marked in advance essentially rules it out: you either fill at your price or you do not fill at all. That is one more reason a calm entry from a level is cheaper than a market rush into the move.
In short: The spread repeats on every trade: at three points it is a huge share of a scalper's five-to-ten-point target, and loose change for an entry aiming at hundreds; less often and more precise is almost always cheaper, and zero spread is not free.
Market liquidity and liquidity pools
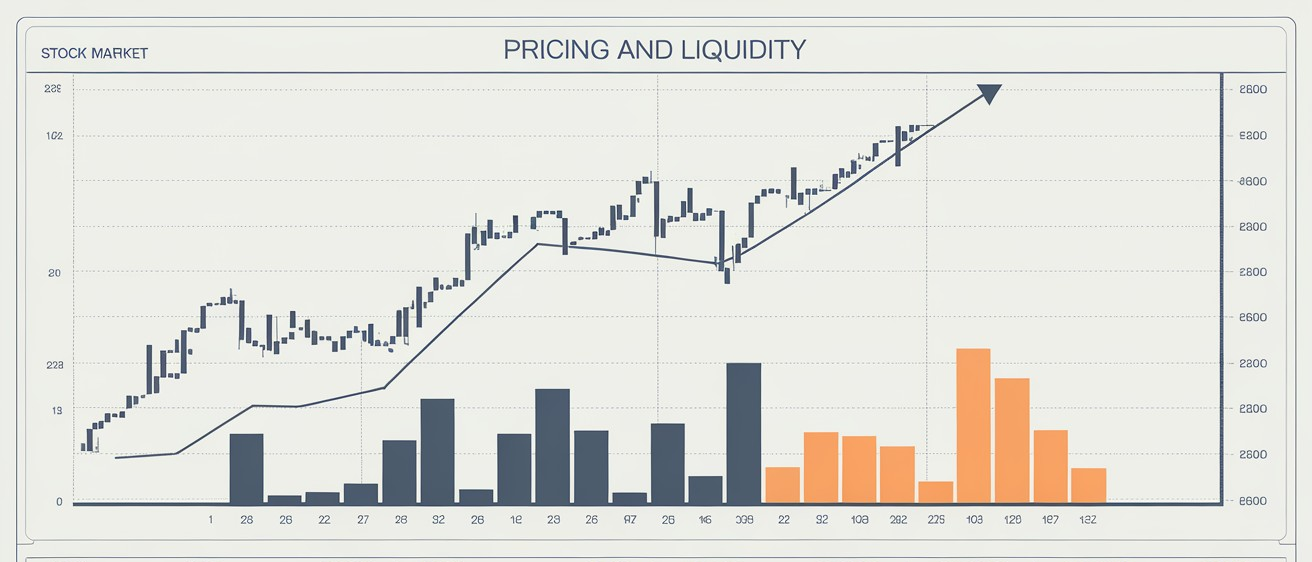
Liquidity is the market's ability to absorb a trading order without a noticeable change in price. On a liquid market, say the major currency pairs or large futures, entry and exit go at the expected price and on a tight spread. On an illiquid one, even a modest order drags price far, and the spread is wide.
For a trader this has direct consequences. Low liquidity means a wide spread, slippage and sharp price gaps, which is why exotics and thin instruments are more dangerous than they look, and I simply do not trade them. But there is a deeper layer, and this one is my territory. The zones where orders and stops pile up are liquidity pools, and big capital knows exactly where they lie. It deliberately pushes price into such a zone, takes the liquidity and turns the move around, and that is the very false breakout, or, as I call it, the liquidity grab. The crowd sets stops in the same obvious places: right under a round level, just past a local low, and that is a zone thick with liquidity. So before I place a stop, I ask myself whether it sits in the single most predictable spot, the one everyone else would pick, and if it does, I shift it a little further, past the zone where the crowd no longer holds orders. How exactly the liquidity squeeze under levels forms is broken down in the course section on working with levels, and the zones themselves I cover in the piece on liquidity pools.
In short: Liquidity is absorbing an order without moving price; on a thin market it means a wide spread and slippage, while the zones where stops gather are pools that big capital drives price toward for a liquidity grab, which is why I hide my stop with room to spare.
Volatility and ATR: the market's breathing
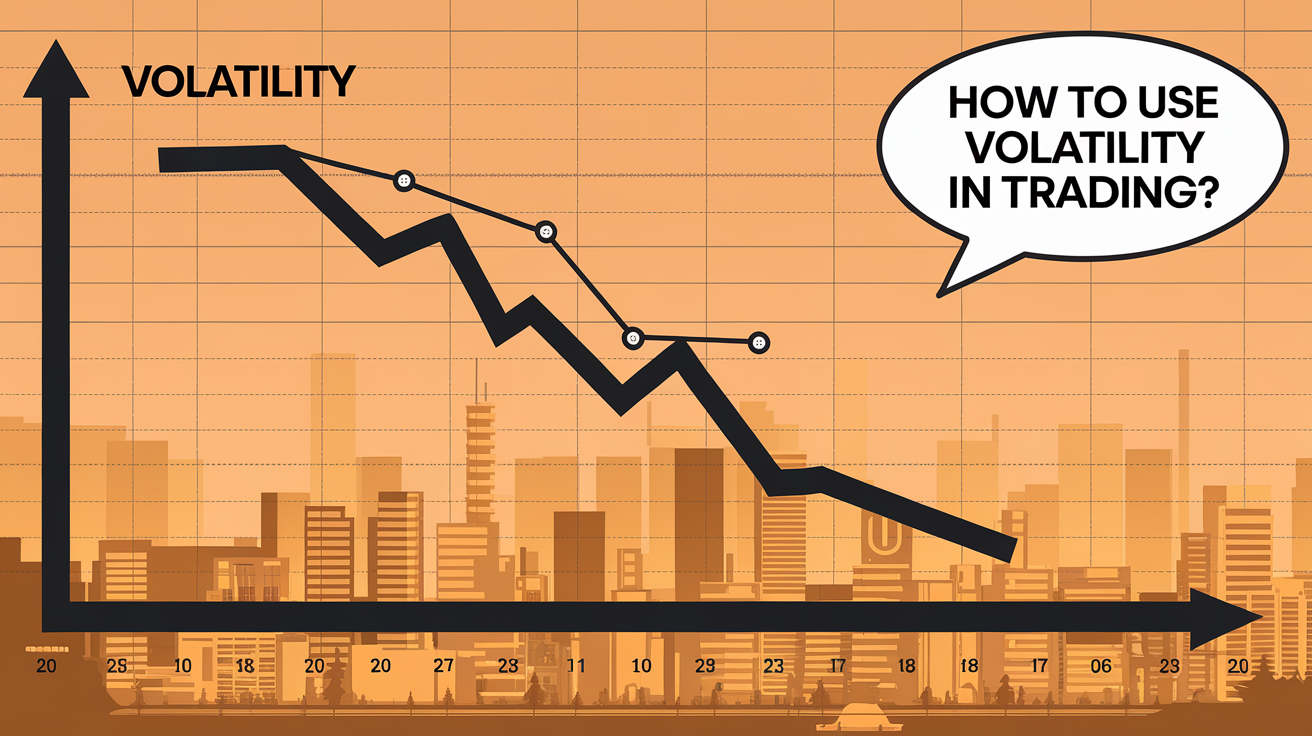
Volatility is a measure of the range of an asset's price swings over a set period. The stronger and sharper price moves, the higher the volatility; the calmer and narrower the range, the lower it is. One thing to separate right away: volatility is about the amplitude of the move, not its direction. The market can surge up, crash down or jerk sharply sideways, and all of it is high volatility.
What matters most to me here is this. Volatility is not constant, it runs in cycles: a phase of compression, when price squeezes into a narrow range, sooner or later gives way to an explosion and a strong move. The market seems to draw breath, then exhale. In the language of the Wyckoff method, that compression phase is often accumulation or distribution, when big capital quietly builds a position before shoving price. But low volatility on its own is not an entry signal, only context: the phase tells you when to be alert, while levels and volume tell you where. To measure volatility as a number, ATR is handy, the average true range over a period, usually fourteen bars, accounting for gaps between sessions; you read its absolute value only against the instrument's own history. And here is my position, important for a beginner: ATR is a gauge of volatility and a risk-management tool, not a buy signal. I take it in two roles, for the width of a stop at one and a half to three ATR from entry, so the stop tunes itself to the market, and for position size, smaller on volatile instruments, larger on calm ones, so risk levels out.
In short: Volatility is range, not direction, and it runs in cycles: compression gives way to an explosion, and by Wyckoff compression is often accumulation; I take ATR as a risk gauge for a stop at one and a half to three ATR and for position size, not as an entry signal.
The market maker: who they are and why they are not to blame for your losses
The Market maker is a professional market participant who, by agreement with the exchange, holds a two-sided quote, meaning buy and sell orders at once, and through that supplies liquidity. Thanks to him there is always someone to trade with in the book, and price moves more smoothly.
The market maker is every trader's scariest fairy tale, the one they pin all losses on: he is supposedly knocking out your stops on purpose. There is a grain of truth. But the picture is more complex. The main thing I want to get across is that he is, first of all, a limit participant. Everyone on the market boils down to two types. Some move price with market orders, buying here and now at any price. Others stand with limit orders at a price chosen in advance and simply wait for a counterparty, moving price not at all. The market maker is one of the second kind, and on his side are algorithms and big money, so retail has no business in a head-on contest with him. He earns above all on the spread, taken across an enormous flow of trades, plus on exchange rebates for supplying liquidity and on reading order flow. His income is built on mass, not on a hunt for your stop in particular.
And here is where the main practical lesson hides. It pays him to buy cheap and sell dear on the same support and resistance levels we see, and to defend his levels. Liquidity he collects where there is plenty of it, in the obvious places the crowd puts stops. The crowd's irrational behaviour is the mirror image of the right one: beginners buy dear at resistance and sell cheap at support, out of fear and greed, and that is exactly why they hand over money. From my observations a trader most often loses not because the market maker is a villain, but because he himself set the stop in the single most predictable spot and stepped in against big capital. By the way, I have nowhere to even show the real CME order book, my trading software simply does not have it, and that does not get in the way, because I look for the large player in volume: if a huge volume passes in a zone and price barely moves, someone big has built or unloaded a position there. Volume matters more than the book, and inside the book the big players also hide their intent with spoofing and iceberg orders, which it is pointless for retail to chase in real time. So I do not wage war on the market maker, I read his logic, hide my stop with room to spare and follow capital rather than fight it. It is the same smart-money logic I break down in the guide on Smart Money. Who is really to blame for traders' losses, I show in detail on real CME volume in the video: who is to blame for a trader's losses.
In short: The market maker is a limit participant who gives liquidity and earns on the spread rather than hunting you personally; a trader more often loses because he set the stop in an obvious spot and went against capital, which is why I read volume, not the book.
How the venue all of this plays out on is built, I break down in the piece on how an exchange works.
Frequently asked questions
Through the balance of supply and demand. When buyers push harder, price rises until enough sellers gather, and the reverse. Price is the participants' agreement at each moment, while the real imprint of that fight shows up in volume, where you see who is holding the move.
Bid is the best price someone will buy at, Ask the best price someone will sell at. All orders stack up in the order book, and the gap between Bid and Ask is the spread. It is the toll for entering instantly: the moment you open a trade you are already down by the spread.
It is the market's ability to absorb an order without a noticeable shift in price. A liquid market gives a tight spread and fills near the expected price; a thin one gives a wide spread, slippage and sharp gaps. The zones where stops pile up are liquidity pools, which big capital deliberately drives price toward.
In my experience it is hard: the book changes every second, and speed and algorithms sit with the large players, who also hide orders with spoofing and icebergs. A beginner stands firmer leaning on levels and volume, where you can already see who actually built a position.
Not yours personally. He collects liquidity where there is plenty of it, and that means the obvious places the crowd puts stops: round levels and local extremes. More often a trader loses not because of a villain, but because he set the stop in the single most predictable spot.
About the Author
Author: Igor Arapov — independent researcher in the psychology of investment decisions and behavioral finance, practising trader since 2013, founder of arapov.trade, author of a trading book series (ORCID: 0009-0003-0430-778X).