Bollinger Bands in Trading: What They Are and How to Use Them
Three lines wrap around price and breathe with it, the channel puffing out when the market is wild and pulling in when it is calm. Those are the Bollinger Bands, and as a volatility map they are genuinely useful, but the familiar habit of trading bounces off the edges in a trend tends to fail more often than it works. You get the most from them together with levels and volume, not as a standalone signal.
Bollinger Bands look pretty and win you over instantly: price seems locked in a corridor, bouncing off the walls, just trade edge to edge. I used to look at them exactly that way myself. On a calm market it even works, and then a trend shows up and all that comfort falls apart. So let us be honest about where the bands really help and where they hand you a false sense of control.
In this article we'll cover:
- Bollinger Bands measure volatility, they are not a buy or sell signal
- trading bounces off the edges is dangerous in a trend, because price can walk one band for a long time
- a squeeze is useful: it flags a building impulse, though it does not tell you the direction
- in my experience the bands open up only paired with levels and volume, on their own they are unreliable
First, about what this channel is built from and what it actually measures.
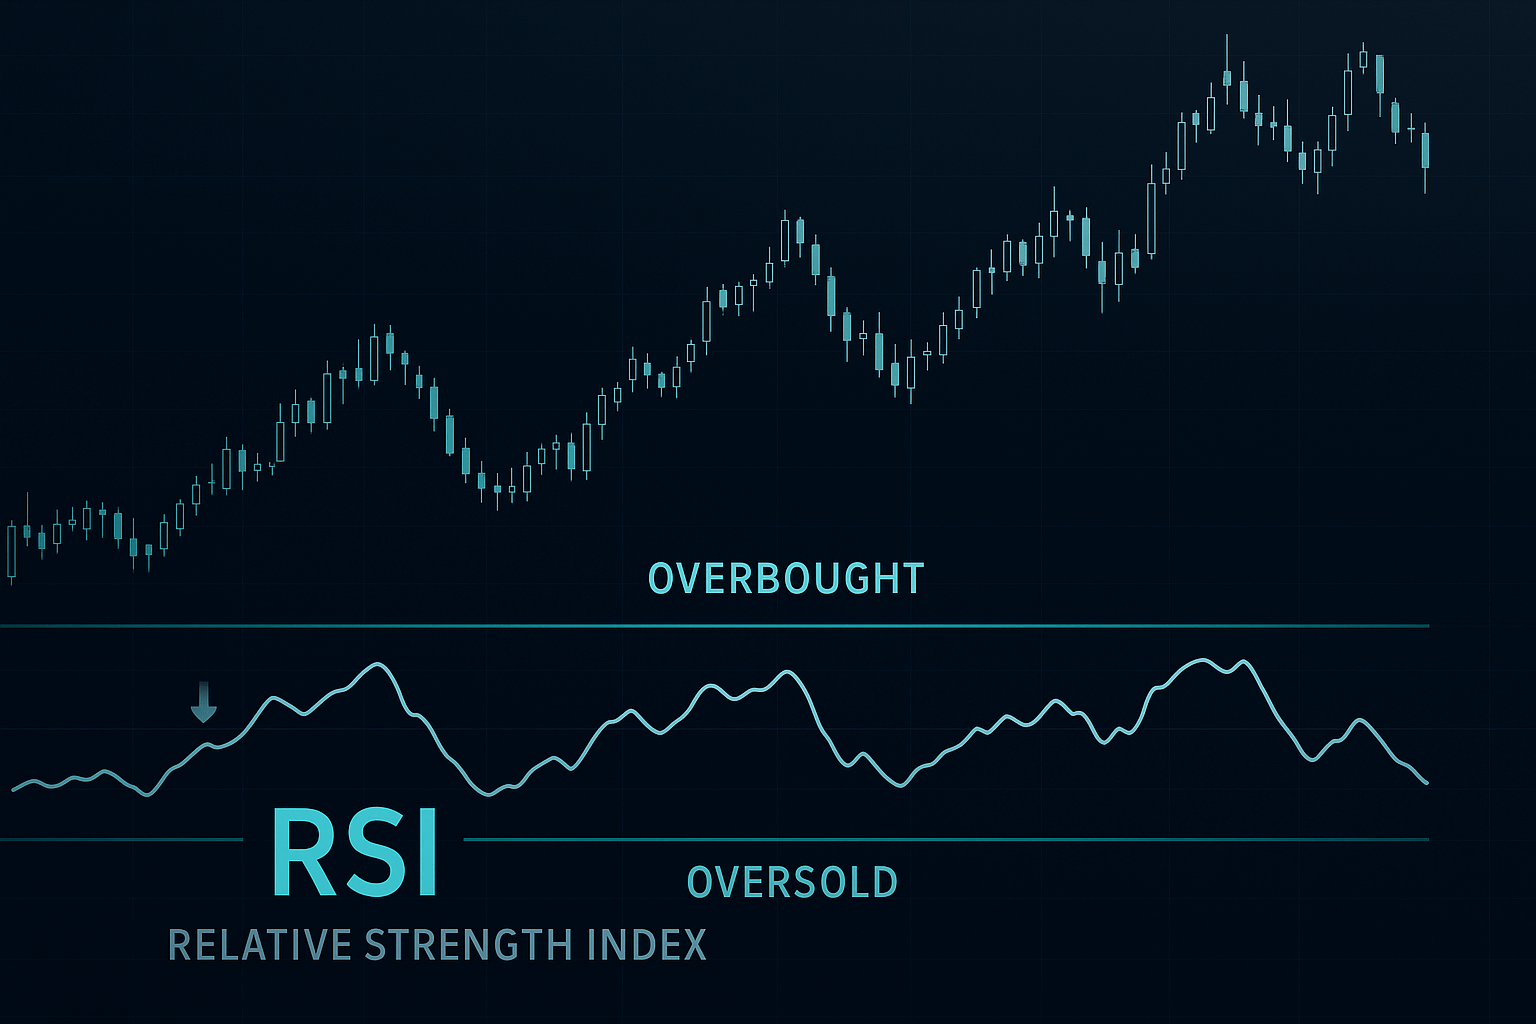
What Are Bollinger Bands and What Do They Measure?
Bollinger Bands are a volatility indicator made of three lines: the middle band is a simple moving average, usually with a period of 20, and the upper and lower bands sit two standard deviations away from it. The financial analyst John Bollinger came up with them in the early 1980s.
That spread is measured by the standard deviation, a statistical gauge of how far price scatters around its average. On the default settings, roughly 95 percent of price moves stay inside the bands, so a move outside them is rare and signals an extreme state. The key thing to take from this: the width of the channel is about the size of the move, not its direction. The market gets stormy and the bands puff out; it goes quiet and they pull in. In practice it is a relative of ATR, only drawn right on top of price instead of on a separate scale below. The nature of these meters I cover in more detail in the section on indicators in trading, and the core idea there is simple: an indicator describes what has already happened to price, it does not predict the future. The bands are an honest thermometer of the market, but a thermometer does not cure, it only shows the temperature.
In short: The bands are a thermometer of volatility set two standard deviations from the average; they show the size of the move but stay silent about its direction.
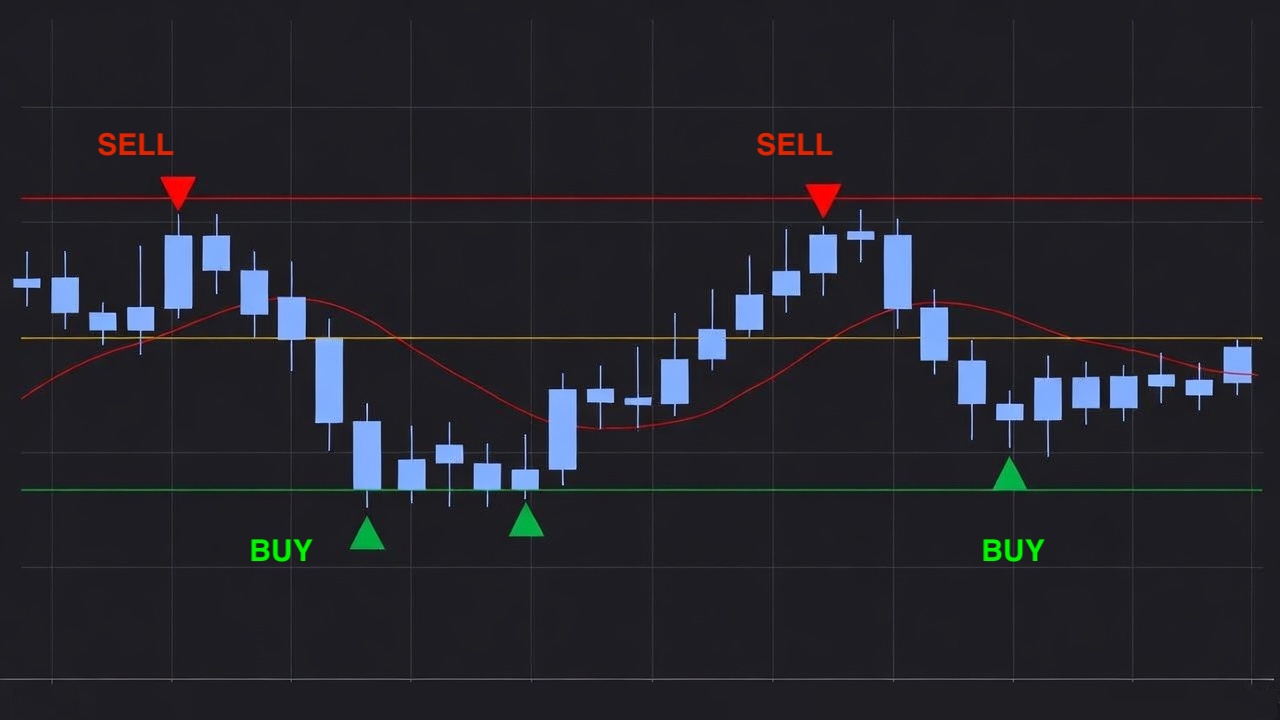
Should You Trade Bounces Off the Bands?
The classic idea sounds tempting: price touched the upper band, sell; touched the lower band, buy. On a sideways, calm market it sometimes pays off, price really does wander wall to wall. But here is the trap beginners burn on. In a strong trend price presses against one of the bands and walks along it for a long time, printing one new extreme after another. Whoever sells the upper band in a rising trend keeps standing against the move and stacking losses until the account runs out. I caught those losses myself in my early years, until the trend taught me to respect its strength.
So a touch of the band I do not treat as a signal on its own. That is my position, and it lines up with what John Bollinger said himself: there is nothing about a tag of a band that is, in and of itself, a signal. The band only tells you the move has gone far relative to the average, not that it is over. Before I do anything at the edge, I look at whether it is a trend or a flat right now, whether there is a significant level nearby, and whether confirming volume is coming in. Without that context the edge of a band is just a line, not a reason to trade. It is the same problem with any indicator signal taken alone: on the first few trades it looks like it works, and over a series it drains the account, which is shown clearly in a video on why indicators like MACD let you down over a series. With the bands it is exactly the same story: they describe the state, and the decision belongs to the level and the volume.
In short: A touch of the band is not a signal: in a trend price walks along it for a long time, so at the edge I first read the phase, the level and the volume.
What Does a Bollinger Band Squeeze Mean?
This is where the bands are genuinely useful. A squeeze, when the channel narrows into a tight corridor, means volatility has dropped to a minimum and the market is gathering strength. Like a coiled spring: a stretch of quiet is almost always followed by a sharp move. The longer and tighter the squeeze, the stronger the shot that usually comes out of it. I use this with ATR too, the logic is the same: low volatility is not forever, the market breathes, and an inhale is followed by an exhale. A narrow channel on a higher timeframe after a long lull I read almost as an alarm: something is building, and it is time to mark levels on both sides in advance so the move does not catch me off guard.
The one limit to keep in mind: a squeeze tells you an impulse is coming, but says nothing about which way it will fire. So on its own it is not an entry signal, it is an attention signal. Often, right before a trending move, the market makes a false break out of the narrow channel, sweeps the stops of those who rushed in on the breakout, and only then goes for real, frequently in the opposite direction. So I read a squeeze as an invitation to get ready and watch the level, not as a command to buy the first false break past the edge. I wait for the market itself to show the side with a hold and with volume, and only then I join in.
In short: A squeeze is an attention signal, not a direction one: the market is gathering strength, but it shows the side with a hold and volume, not with the first false break out of the channel.
Measuring the squeeze: BandWidth and the Keltner Channel
A squeeze is easier to act on when you measure it instead of eyeballing it. The simplest tool is BandWidth, which plots the distance between the upper and lower bands as a single number: when that number drops to its lowest in many months, the compression is real, not just a chart that happens to look a touch tight. A neater check, popularised by John Carter, is to overlay a Keltner Channel, a similar envelope built from the average range. While the Bollinger Bands sit entirely inside the Keltner Channel the squeeze is on, and the moment they push back outside it the squeeze fires. That turns a vague impression into a rule you can actually see.
Useful as that is, it changes nothing about the core limit. A measured squeeze tells you only that volatility has compressed to an extreme and a move is loading, never which way it will break. So I treat BandWidth or the Keltner overlay as a cleaner alarm clock, not as a direction signal: when it rings I mark the levels on both sides and wait for price to choose a side with a hold and with volume. The measurement sharpens the timing of my attention, while the decision still belongs to the level and the volume.
In short: BandWidth puts a number on the squeeze and a Keltner Channel overlay turns it into a rule (bands inside means on, outside means it fires), but a measured squeeze still only flags that a move is loading, never its direction.
How to Use Bollinger Bands With Volume (and the Right Settings)
This is where the bands open up best. On their own they show only the size of the move, but who stands behind that size shows up in volume. Price moves past the band on rising volume, that tells of real strength, there is money behind it. It moves past the edge on weak volume, most likely it is an exhale, and the move will quickly snap back into the channel. That combination is exactly what separates a real breakout from an empty false break, which a single band cannot tell apart. In practice I look at it this way: price broke the upper band, I immediately shift my eyes to the volume indicator below. Volume jumped above average, the move is real, money is behind it, and it can be worked in its direction. Volume is sluggish while price is outside the band, it is an exhale on a thin market, and I wait for the return into the channel instead of buying the highs. The same break past the edge on different volume means the exact opposite things.
In my experience it is the trio of bands plus volume plus level that gives the meaning a single indicator lacks. The band shows price has gone far, volume confirms or denies the strength, the level sets the point of decision. And my view, which parts ways with most teaching pictures: do not trade a bounce off the band just because price touched it. First read the market phase and look at the volume. Leave the default settings, period 20 and deviation 2, and use the bands for two things: to see the squeeze before an impulse and to gauge how far price has gone from the average. The bands are useful exactly in the part where they measure, and they cost you money in the part where people try to turn them into an entry generator. What to replace a blind indicator signal with and how to read volume I put together in the free course section on volume analysis. It is also worth comparing the bands with the ATR indicator and other trading indicators, to see their shared nature: they are all derived from price. This is not advice to you personally, it is the principle I stick to: for an entry I still need a level and an understanding of current volatility, not one pretty line.
In short: The trio of band plus volume plus level separates a real breakout from an exhale, and one line on its own cannot do that.
Frequently Asked Questions
They show volatility: how far price has moved from its average. The channel widens on an active market and narrows on a calm one. About the direction of the move the bands themselves say nothing.
No. John Bollinger himself stressed that a tag of a band is not, in and of itself, a signal. In a trend price walks one band for a long time, printing new extremes, so selling the upper band in an uptrend just stacks losses. A touch only says the move has gone far from the average, not that it is over.
In a flat sometimes yes, but in a trend it is dangerous: price can walk one band for a long time. I do not treat a touch of the band as a signal without confirmation from a level and volume.
A squeeze means volatility is dropping and the market is gathering strength before an impulse. It is an attention signal, not a direction one: where price will go the bands do not show, so you need analysis of the level and volume.
With the BandWidth indicator, which plots the distance between the bands as a number: a multi-month low means a real squeeze. A neater check is to overlay a Keltner Channel, when the Bollinger Bands sit entirely inside it the squeeze is on, and when they break back outside it fires. Either way the measure flags only that a move is loading, never its direction.
The standard is a period of 20 and a deviation of 2, recommended by the indicator's author. A smaller period makes the bands more sensitive and noisier, a larger one smooths them. A beginner is better off starting with the default values.
About the Author
Author: Igor Arapov — independent researcher in the psychology of investment decisions and behavioral finance, practising trader since 2013, founder of arapov.trade, author of a trading book series (ORCID: 0009-0003-0430-778X).