The stochastic is a momentum indicator. It shows whether price closed near the top or the bottom of its recent range, and it gives three signals: overbought zones, oversold zones, and a crossing of two lines. In my experience it behaves more sensibly in a range than in a trend, and on its own it can't be an entry point.
The stochastic is one of the first indicators almost every beginner passes through. I went through them myself, I've traded for many years, and I spent a couple of early years on indicators specifically. I don't use them for forecasting, volume aside. But since you're looking for the stochastic in particular, let me sort it out without blind faith and without blind denial: what it really shows and where its limits lie.
In this article we'll cover:
- the stochastic shows the position of price within its recent range, not the future;
- its signals are zones above 80 and below 20 plus the line cross, and overbought is not a command to sell;
- in a range it's more meaningful, while in a strong trend it sticks at the edge for a long time and deceives;
- in my experience it lags, so I build the decision on volume and levels.
Start with what this indicator even measures.
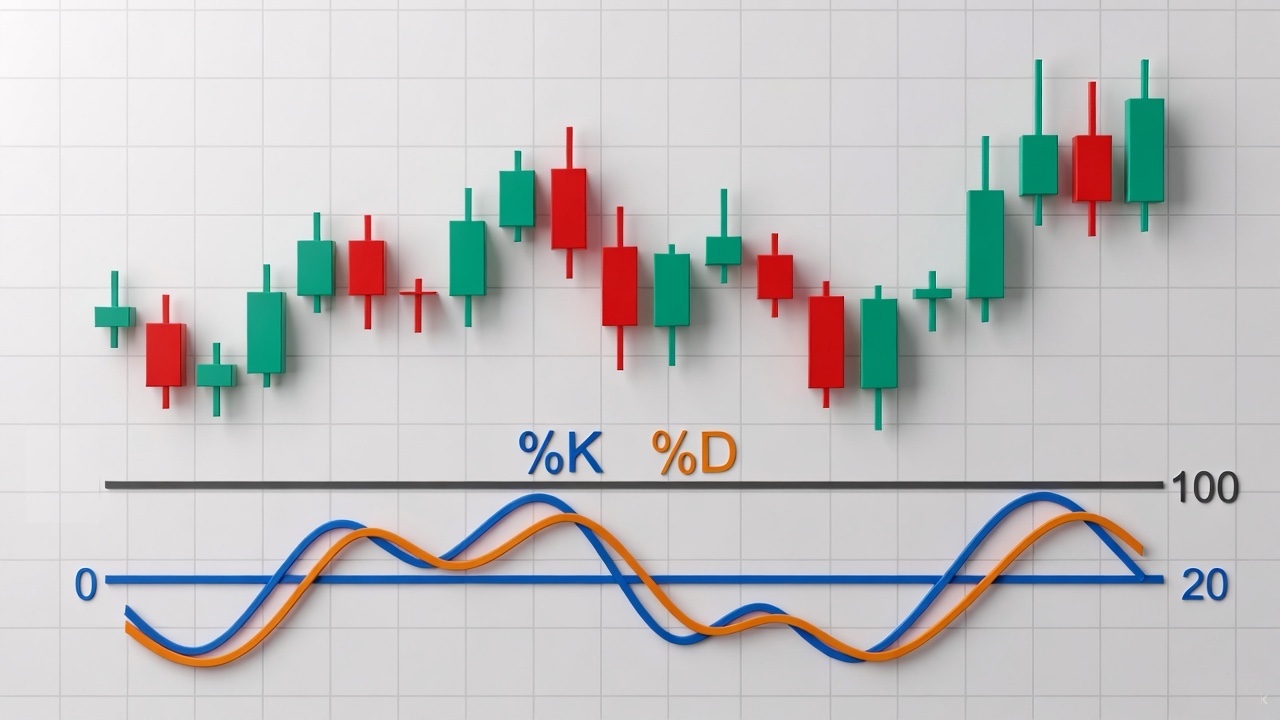
What is the stochastic oscillator (%K and %D)
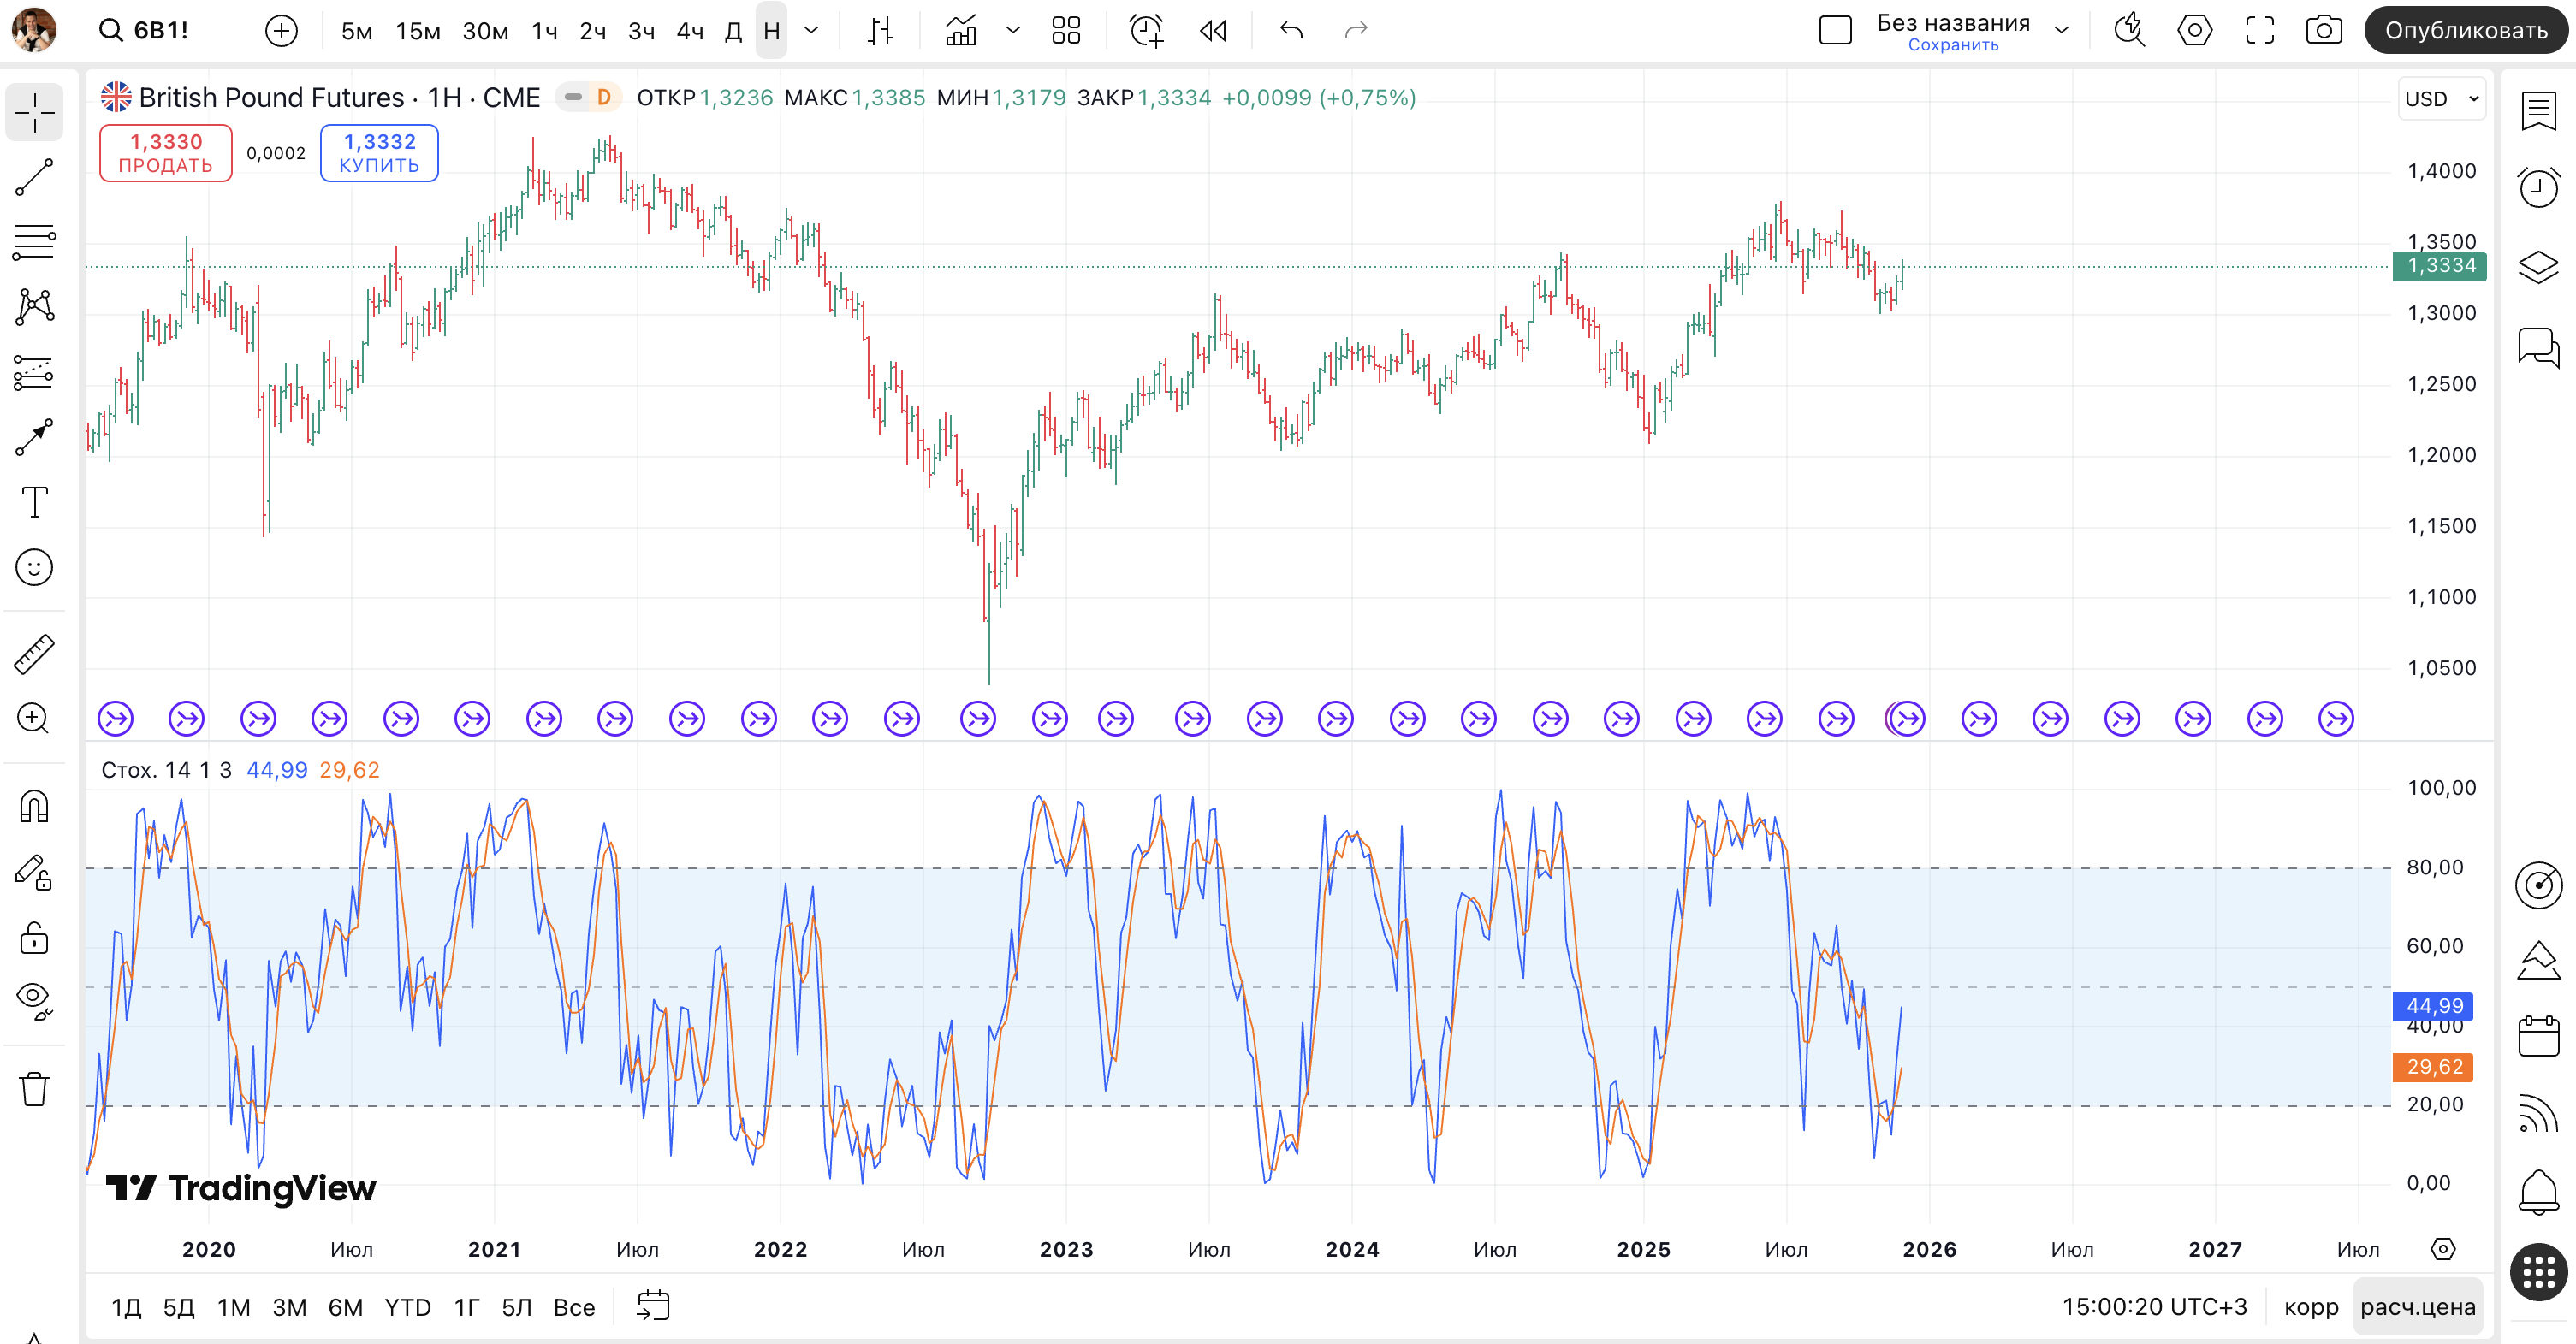
The stochastic is a momentum indicator that compares the closing price with the range of highs and lows over a chosen period and plots the result as two lines on a scale from 0 to 100. The idea is tied to George Lane and a group of Chicago traders, worked out back in the 1950s. The logic is simple. In a rise price closes nearer the upper edge of its range, in a fall nearer the lower. A common default period is 14. On the chart you see two lines: %K is the main one, and %D is its smoothed version, an average over a few periods, running as the signal line. There's a fast and a slow stochastic. The fast one is more sensitive and errs more often, the slow one is smoothed and throws fewer false signals. At heart this is one of many technical-analysis indicators, and my general stance on them I unpack in the section on indicators in the course.
In short: The stochastic is a momentum indicator: it compares the close with the range of highs and lows over a period and plots two lines from 0 to 100, where %K is the main one and %D the smoothed signal.
Stochastic settings and the %K formula: 14, 3, 3 and fast versus slow
Under the two lines sits a simple sum. %K asks one question, where did the candle close inside its recent high-low range, and turns it into a number from 0 to 100: a close right at the top of the range gives a value near 100, right at the bottom near 0. The formula is just the close minus the lowest low, divided by the highest high minus the lowest low, times a hundred. %D is then a short average of %K, three periods by default, and it runs as the slower signal line. Knowing this much explains everything the indicator does: it is not measuring price as such, only where price sits inside its own recent range.
The setting you will see written as 14, 3, 3 means a fourteen-bar lookback, a three-bar smoothing of %K, and a three-bar %D. That is the sane default. The raw, unsmoothed version is the fast stochastic, which fires constantly and mostly noise; the smoothed one most platforms show by default is the slow stochastic, calmer and with fewer false signals. Shorten it, say to 5, 3, 3, for faster scalping signals at the cost of more noise; lengthen it, to 21, 5, 5, for a slower, quieter read. As everywhere, there is no magic setting that turns the thing into a money machine: the default 14, 3, 3 covers most tasks, and hunting the perfect number on a past chart is the usual curve-fitting that falls apart on the next one.
In short: %K measures where the close sits in the recent high-low range from 0 to 100 and %D is its smoothed signal line; the default 14, 3, 3 (the slow stochastic) is the sane starting point, faster settings only add noise, and there is no magic number.
Stochastic signals: the line cross and the overbought zone
The stochastic has three signals. The first is the zones. A value above 80 is called overbought, below 20 oversold. This is where beginners stumble: overbought is not a command to sell, only the fact that price closed near the top of its range. In a strong move it can hold there for a very long time. The second signal is the line cross. When %K crosses %D from below upward it's read as a reason to buy, from above downward as a reason to sell.
The third signal is divergence, and Lane himself considered it the main one. Divergence is a disagreement: price prints a new high while the indicator no longer does, meaning momentum is fading. How exactly divergences on indicators are read has a separate piece. One thing I'll add: divergence is a hint, not a signal in itself, and entering on it without confirmation is risky.
In short: The stochastic has three signals: zones above 80 and below 20, the %K and %D cross, and divergence; but overbought is not a command to sell, only price closing near the top of its range.
Stochastic in a range vs a trend: where it works and where it fails
Here is where the indicator's main trap hides. The stochastic behaves best in a sideways market. When the market moves in a range, price reliably bounces off the boundaries, and its zones of 80 and 20 really do hint at reversals inside that range. In this it's genuinely useful, though I'll be honest that those zones tend to line up with the very support and resistance of the range, which I'd be reading anyway. In a strong trend it lets you down. In a rising market the stochastic can sit above 80 for weeks. On the euro future I've seen this picture more than once: the indicator has long been in overbought while price calmly carries on higher. Selling on every such signal means cutting your profit and trading against the move. In a fall it's the reverse: it sits below 20, and buying off it turns into catching knives. So the market phase is worth determining in advance. What a trend and a range are, and how to tell them apart, is covered in the course. Stochastic signals in a trend I'd watch only in the direction of the trend itself, not against it.
In short: In a range the stochastic reliably works the zones of 80 and 20, while in a strong trend it sticks to the extreme zone and generates signals against the move, so in a trend I watch it only with the trend.
Stochastic and a moving average together: why they contradict each other
Beginners often hang several indicators on the chart at once, hoping for accuracy. And they get the opposite. A simple example. The stochastic shows oversold and hints at buying, while a moving average at the same time shows a downtrend and hints at selling. Whom do you believe? Both are sometimes right, sometimes not. The signals conflict, and the decision is still yours to make, only now with a muddle in your head.
The reason is that almost all indicators, the stochastic and the RSI oscillator included, are derived from one and the same price. They recompute it with different formulas and inevitably lag: to get a signal a bar must close first, which means you always walk a step behind the market. So I don't pile them on top of each other. Instead I watch volume and levels. Volume shows whether there's a real large participant behind the move, and that's a cause, not a consequence. This isn't advice for you personally, it's how I work. Why indicators lose to the analysis of supply and demand in the first place I show on live charts in the video on why indicators don't work. The stochastic isn't evil for all that, just a tool with a narrow field of use, and keeping that in mind is more honest than believing in it blindly.
In short: Indicators are derived from one price and lag, so stacking them on each other only piles up a muddle; instead I read volume and levels, since volume is the cause of a move, not its trace.
Frequently asked questions
It shows whether price closed nearer the top or the bottom of its recent range. Near the top the value is high, near the bottom low. At bottom it's a gauge of momentum, not a predictor of the future.
Most often the default is a period of 14, signal-line smoothing of 3, and zones at 80 and 20. These are starting values, tuned to the instrument and the timeframe. There are no universal numbers.
Both are momentum oscillators on a 0-to-100 scale, but they ask slightly different questions: the stochastic shows where the close sits in the recent high-low range, handy for timing entries in a range, while RSI measures the broader strength of the move. Because both are built from the same price they tend to agree, so running them together rarely gives a truly independent second opinion.
No. A reading above 80 only means price closed near the top of its recent range. In a strong uptrend the stochastic can stay above 80 for weeks while price keeps rising, so selling on the reading alone trades against the move. Overbought is a reason to look closer, not a command, and it carries weight mainly in a range.
Because in a strong trend price holds at one edge of the range for a long time. The indicator sticks above 80 or below 20 and fires signal after signal against the move. In a range that problem almost vanishes, and there it's more meaningful.
In my experience, no. It lags and is derived from price, so on its own it often deceives. If you do use it, then as a helper in a range, while I build the core of the decision on volume and levels.
About the Author
Author: Igor Arapov — independent researcher in the psychology of investment decisions and behavioral finance, practising trader since 2013, founder of arapov.trade, author of a trading book series (ORCID: 0009-0003-0430-778X).