The Ichimoku cloud is a composite indicator built from five lines. It lights up trend, momentum and support-resistance zones all at once, and its core is the shaded cloud between two of those lines. From what I've seen, under the elaborate picture sit ordinary moving averages shifted in time, so Ichimoku lags and on its own doesn't replace the analysis of volume and levels.
Ichimoku puts beginners off at first glance: five lines, Japanese names, a cloud across half the screen. It feels as if some special market secret is hidden inside. I've worked off volume and levels for a long time and don't take indicators for forecasting, volume aside. But since you've opened the Ichimoku topic, let's sort out what this thing actually is, what the cloud shows, and whether a beginner has any reason to spend time on it at all.
In this article we'll cover:
- Ichimoku is five lines that hand you trend, momentum and support with resistance at once;
- the Kumo cloud is the core of the indicator: price above it is bullish, below it bearish, inside it fog;
- every line is computed from the same price and shifted in time, hence the built-in lag;
- from what I've seen a beginner gets further starting with levels and volume, which give the same read without five lines.
Let's start with what this indicator is even cut from.
What is the Ichimoku indicator, and what are its five lines
Ichimoku is a technical-analysis indicator of five lines that, on a single screen, gives the direction of the trend, its strength, and zones of support and resistance. The full name translates roughly as the one-look equilibrium chart.
It was put together by the Japanese journalist Goichi Hosoda and made public in 1969 after years of calculation. There are exactly five lines. Tenkan is the fast line over 9 periods, Kijun the slow one over 26. Senkou A and Senkou B are pushed forward and form the cloud. Chikou is the current price thrown 26 periods back. The thing worth grasping straight away is that each of these lines is simply the midpoint between the high and the low over its own stretch, in other words a kind of moving average, only shifted in time. This is one of the most overloaded indicators in technical analysis, and why they all lag I unpack in the section on indicators in the course.
In short: The five Ichimoku lines are kinds of moving average shifted in time; the pretty wrapper doesn't change the fact that they're computed from past price.
How to read the Ichimoku cloud: trend, support and resistance
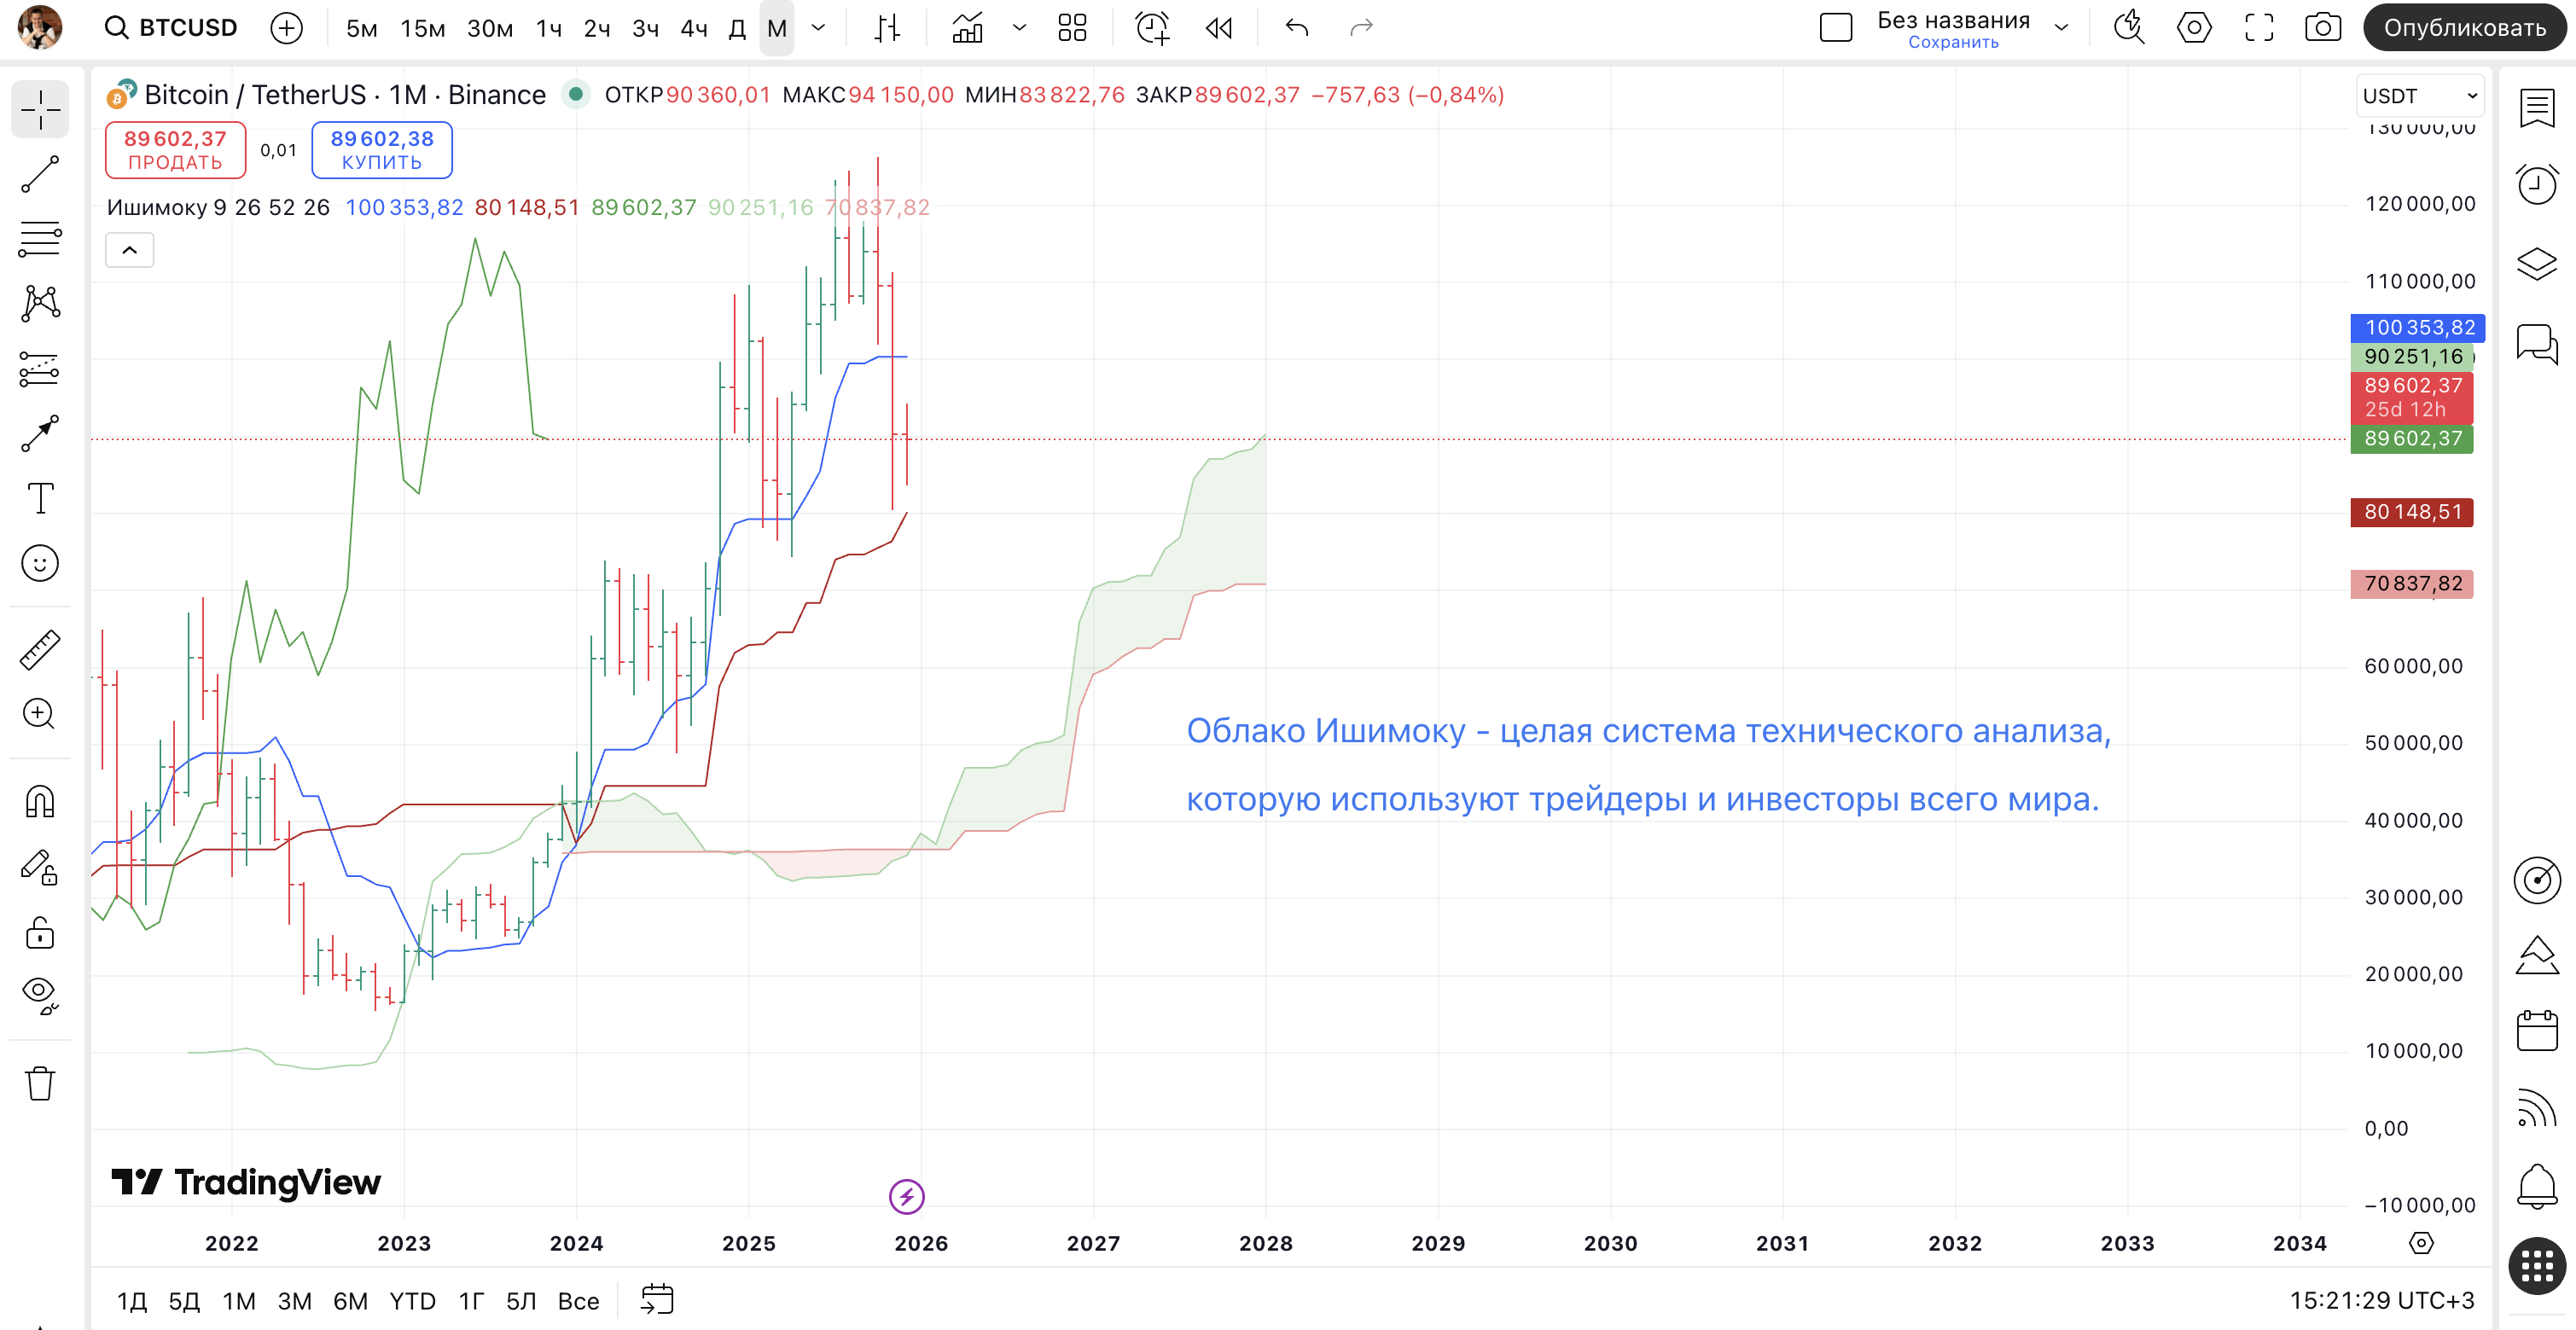
The Kumo cloud is the shaded area between Senkou A and Senkou B, and it's the heart of the whole tool. Reading it is simple. Price above the cloud means the market is in an uptrend, and the cloud props it up from below as support. Price below the cloud means the trend is down, and the cloud presses from above as resistance. Price inside the cloud is a muddle and a range, and I wouldn't poke around in there.
The thickness of the cloud hints at how solid the zone is: a thick one is hard to break, a thin one easy. On top of that the cloud is projected forward, so future zones are visible in advance. It sounds neat. In practice, what Ichimoku draws as support tends, on my futures charts, to land squarely on a plain horizontal level, just served up more elaborately. The nature of the trend move itself doesn't change because of that, and what trend and range actually are I lay out in detail in the course.
In short: Price above the cloud is trend up, below it down, inside it a range; but what the cloud calls support usually coincides with an ordinary horizontal level.
Ichimoku signals: the Tenkan-Kijun cross
The main signal is called the TK cross, the crossing of the fast Tenkan and the slow Kijun. Tenkan cutting Kijun from below upward is read as a bullish sign, from above downward as bearish. The strength depends on where it happened relative to the cloud: above the cloud the cross is counted as powerful, inside it neutral, below it feeble. The Chikou line is held alongside as confirmation: when it sits above the price of the past, that's a plus for the bullish case.
And here's where the main caveat hides. A cross of two averages is always an event after the fact: for the lines to meet, price already had to go there and come back. So the signal arrives once the move has largely happened. That's why I treat such crosses not as a command but as a late retelling of what was already visible in price and volume themselves. A signal with the trend I might still glance at, against the trend almost never.
In short: The TK cross is a crossing of two averages after the fact: by the time the signal lands the move is already done, so I take it only with the trend, against the trend never.
Is the Ichimoku cloud good for beginners?
Learning Ichimoku is realistic, usually a couple of evenings are enough to memorise the five lines and the cloud rules. The difficulty here isn't the maths but the psychology: five lines create the feeling that you're seeing more than there actually is. Under the hood, I'll repeat, are the same shifted averages, and all of them are derived from one and the same price.
So my position is this. If you like the visual of the cloud and trade with the trend on higher timeframes, Ichimoku has a right to exist as a trend indicator, and there it's useful. But I wouldn't advise a beginner to start with it. The same things, trend and support with resistance, are simpler and faster to pull off horizontal levels and volume, without five Japanese lines on the screen. That's not a recommendation to you, it's how I'd move. Why indicators give way to reading supply and demand directly I show on live price charts in the video on why indicators don't work. Ichimoku isn't bad, it's just an over-complicated way to spot what's already on the chart.
In short: It's easy to learn, but a beginner is better off not starting with it: trend and levels read faster directly, and you can return to the cloud later if you want.
Frequently asked questions
It hands you several things at once: the direction of the trend, its strength, and the zones where price met support or resistance. The key reference is the cloud: above it the market leans toward a rise, below it toward a fall.
The classic values are 9, 26 and 52. They come from the old Japanese six-day trading week: 9 is about a week and a half, 26 roughly a month, 52 roughly two months. Many leave them on default, while some retune them for a five-day week.
It's easy enough to learn, but I wouldn't start a beginner on it. The five lines create an illusion of depth, while underneath sit ordinary moving averages. Trend and levels are simpler to read directly, and you can come to Ichimoku later if you want.
As a trend indicator on higher timeframes the cloud holds up fairly well. As your only entry tool it lags, since every line is derived from price that has already passed. I'd confirm the picture with volume and real levels rather than trust the cloud on its own.
About the Author
Author: Igor Arapov — independent researcher in the psychology of investment decisions and behavioral finance, practising trader since 2013, founder of arapov.trade, author of a trading book series (ORCID: 0009-0003-0430-778X).