Price, the theory says, moves in cycles of eight waves: five run with the trend and three pull back against it, all driven by crowd psychology rather than magic. The idea is popular, half the charts online are marked up this way, but it is also deeply subjective. So I treat it as a read on market mood, not as a precise forecast.
Elliott waves are everywhere: open any chart online and the odds are someone has labelled it one through five. I do not trade by them myself, and below I explain why. I have been at this a while, and I think a beginner is better off understanding what waves are, if only to judge other people's forecasts with a clear head and not mistake a pretty picture for the truth. So let us go through the theory itself and its weak spot.
In this article we'll cover:
- Elliott waves are about crowd psychology: an impulse with the trend and a correction against it;
- a full cycle is eight waves, five impulse and three corrective, plus three hard rules;
- Fibonacci levels are used as guides for how deep corrections run and where targets sit, but they are no guarantee;
- the theory's main problem is subjectivity: the same chart gets marked up in completely different ways.
First, what Elliott actually came up with and what a cycle is built from.
What Is Elliott Wave Theory and Who Created It?
Elliott Wave Theory is a method of technical analysis that describes market movement through repeating waves that reflect crowd psychology. The American accountant Ralph Nelson Elliott came up with it back in the 1930s, studying stock-market charts.
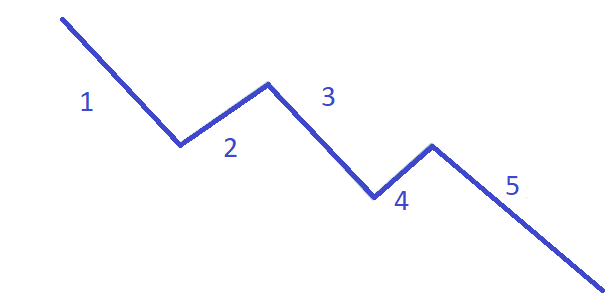
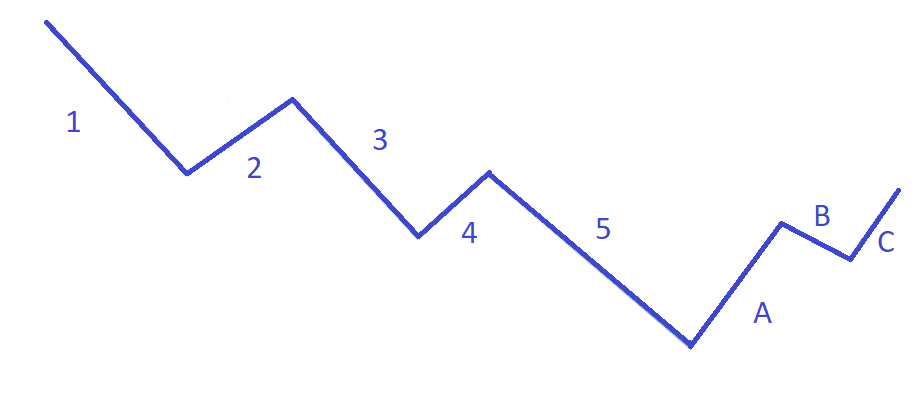
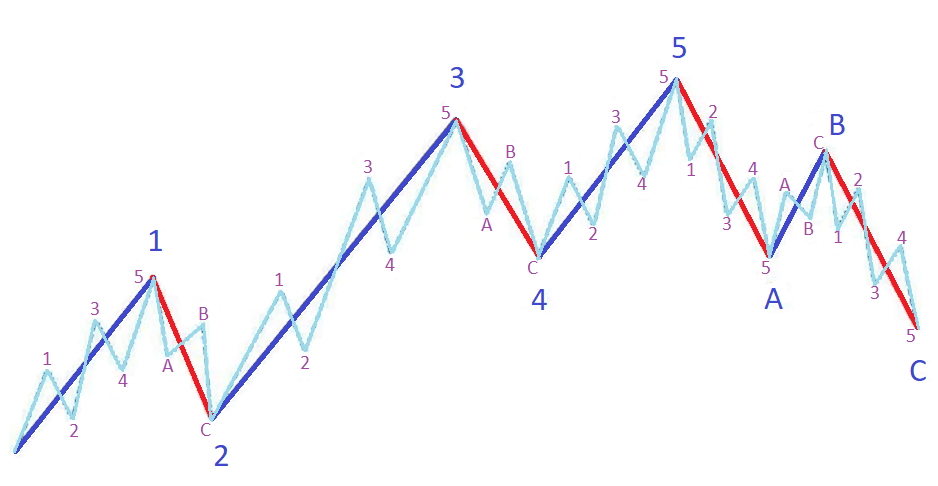
His idea was that price moves not at random but in cycles, because masses of people behave alike again and again. A full cycle is made of eight waves. Five waves form an impulse with the trend, numbered 1 through 5. Another three are a correction against the trend, labelled A, B, C. A key feature of the theory is its fractal nature: every large wave is made of the same smaller waves inside. In essence it is about the same thing I talk about: there is a phase where the crowd piles into a move, and a phase where it doubts and takes profit.
In short: Elliott Wave Theory describes the market through repeating waves that reflect crowd psychology: a full cycle is eight waves, five impulse with the trend and three corrective against it, and the structure is fractal.
The 5-3 Wave Structure, the Three Rules, and Fibonacci
In an impulse each wave has its own psychology. The first is a timid start, when hardly anyone notices the trend yet. The second pulls back, testing the move for strength. The third is the strongest and longest, the main crowd piles in, often on the fear of missing out. The fourth is a breather and a flat, and the fifth is a final push on euphoria, already on weakening volume. Then comes the three-wave correction, A, B, C.
The theory has three hard rules you cannot break: the second wave does not drop below the start of the first, the third is never the shortest, and the fourth does not enter the price territory of the first. The depth of corrections and the targets are usually gauged by Fibonacci levels: corrections often land in the 38 to 62 percent range, and the target of the third wave is frequently around 162 percent of the length of the first. Just keep in mind these are guides, not a guarantee. What is actually worth checking is volume: a real third wave runs on rising volume, while weakening volume on the fifth gives away the exhaustion of the trend. These market phases are covered in detail in the course.
In short: Each wave has its own psychology, from the timid first to the euphoric fifth on weakening volume; there are three hard rules and Fibonacci guides (corrections of 38 to 62 percent, the third wave's target near 162), but these are probabilities, not a guarantee.
Do Elliott Waves Actually Work? The Subjectivity Problem
Now, as a practitioner. I have been in the market a long time, and over the years I studied Elliott waves too, but these days I do not trade by them. The main reason is subjectivity. Give the same chart to ten analysts and you get ten different counts, often with opposite conclusions. Worse, the waves fit beautifully in hindsight: after a move it is always clear where the first was and where the third. But at the right edge of the chart, where the decision is actually made, that clarity is almost never there.
This is not an attack on the tool, it is popular and some people use it successfully. I just prefer to lean on more objective things: real support and resistance levels, volume, and phases by the Wyckoff method, where supply and demand are visible right on the chart. In my experience levels are more informative than wave counts. If you do try to trade by Elliott, treat the count as a version, not the truth: enter only on confirmation, stop behind the structure, risk one to two percent per trade. This is not advice to you personally, it is how I approach risk in general. Why I choose volume and levels I go through in the Wyckoff method, and a live take on the waves themselves is in the clip the main flaw of Elliott waves.
In short: The theory's main trouble is subjectivity: ten analysts mark one chart in different ways, and the waves are easily fitted in hindsight, so I prefer objective levels, volume, and phases by Wyckoff.
Frequently Asked Questions
A theory that the market moves in repeating cycles of eight waves: five with the trend and three against it. At its core is crowd psychology. It is useful as a read on market mood, but not as a precise forecast.
The second wave does not drop below the start of the first. The third is never the shortest of the impulse waves. The fourth does not enter the price territory of the first. If even one rule is broken, the count is wrong.
Fibonacci levels are used as guides: corrections often land in the 38 to 62 percent range, and the target of the third wave is frequently around 162 percent of the length of the first. But these are probability guides, not a guarantee.
For subjectivity: ten analysts mark the same chart in different ways, and the waves themselves are easily fitted in hindsight. At the right edge of the chart, where the decision is made, there is usually no clarity. That is why I prefer levels and volume.
About the Author
Author: Igor Arapov — independent researcher in the psychology of investment decisions and behavioral finance, practising trader since 2013, founder of arapov.trade, author of a trading book series (ORCID: 0009-0003-0430-778X).