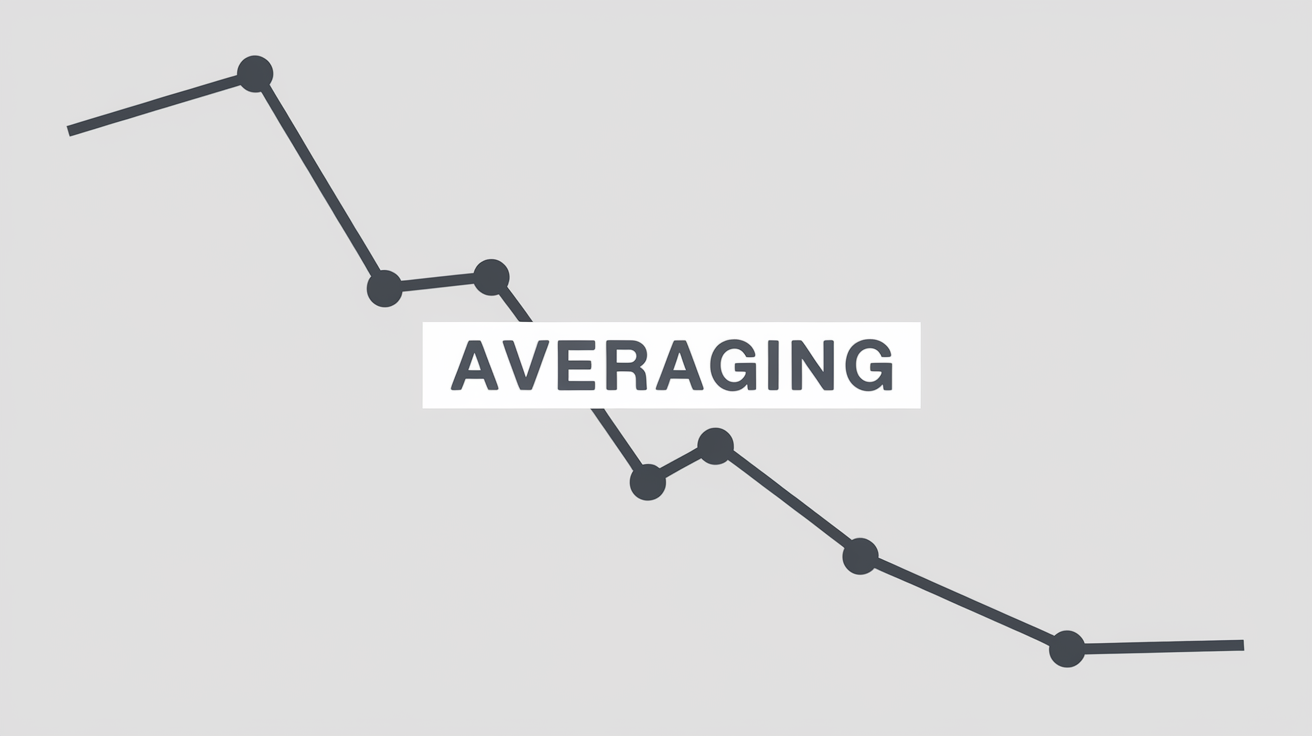
Price gets dragged toward the same obvious levels for a reason, not by chance. Sitting just above swing highs and below swing lows is a cluster of stop orders and pending entries, and large capital needs exactly that resting volume to fill a big position without shoving the market against itself. So price reaches for those clusters. The same idea holds on any liquid market: stocks, futures, forex, crypto.
The topic looks complicated because of the labels stacked on top of it, yet underneath it is plain old volume analysis wearing a new name. I will walk it in order: what these zones are, how big players collect stops, how to find them on your own chart, and how I build an entry. One thing up front: I do not treat the false break itself as a signal, and I will say what I wait for instead.
In this article we'll cover:
- a liquidity pool is a cluster of stops and pending orders at obvious levels;
- liquidity above highs and below lows is the fuel large capital runs on;
- a liquidity grab collects those stops with a false break before the real move;
- after liquidity is taken, price can reverse or keep running, and telling which is the skill.
Start with what these zones are.
What is a liquidity pool in trading?
A liquidity pool is a zone on the chart where a large number of stop orders and pending entries pile up. They split into two kinds. Buy-side liquidity sits above highs: the stops of sellers rest there, alongside breakout buy orders. Sell-side liquidity sits below lows, where the stops of buyers rest. The densest pools form at equal highs and equal lows, where the crowd stacks stops in one spot.
Here is why it works. Banks and funds cannot dump huge size into the market at once without pushing price against themselves. They need ready liquidity, so they go where it already rests. This is a direct extension of the Smart Money framework: the most obvious levels turn out to be the ones most loaded with orders.
It helps to split liquidity into external and internal. External sits beyond the extreme highs and lows of a range, the loud targets price reaches for on a reversal. Internal sits inside the range, in unfilled gaps and local extremes, and often gets cleared on the way to the external pool. There is a trendline flavor too: when everyone draws the same diagonal and tucks stops under it, large capital collects them with a single false break. The more obvious a level is, the denser the orders under it, and that is the key to the whole topic.
Why call liquidity the fuel of the market. For price to travel far it needs counter-orders, and most of them sit in the pools. So big moves almost always start from a sweep of liquidity and stretch toward the next pool. Look at a chart this way and the random-looking pushes line up into one logic: the market walks from stops to stops, refueling along the road.
What we just described has settled names that people search by. The pool above the highs is called buy-side liquidity, BSL: the stops of short sellers sit there, and to collect them price is driven up. The pool below the lows is sell-side liquidity, SSL: the stops of long holders sit there, and price is pushed down to reach them. Equal highs and equal lows, EQH and EQL, are marked separately: a flat double top or bottom looks to the crowd like a solid wall, but to large capital it is a doubled, especially tempting pool, and that is where it drags price. The names are newer, but the essence is the one I described: liquidity is the fuel, and price moves to where there is more of it.
In short: A liquidity pool is a stack of stops and orders at obvious levels: buy-side above highs, sell-side below lows, densest at equal highs and equal lows.
Liquidity grab vs stop hunt vs liquidity sweep: what is the difference?
The three words point at one mechanic, told from different distances. Price approaches an obvious level, say equal highs where stops have stacked up. Large capital nudges price a touch above, triggers those stops, and catches breakout buyers in the same motion. That flood of orders hands the big player the volume to build a position. A liquidity grab is the broad name for tapping those resting orders; a stop hunt is the sharp push that does it; a sweep is the slower version that works through several levels.
To me they are one phenomenon under three labels, and the tell is always the same: a volume spike on the false break. A grab fires real orders, so the burst shows up on the volume. If a level breaks with no spike, no large orders went through, and I treat that as an empty false break, not a grab. And to be clear: triggering other people's stops is standard execution for big positions, not a crime. The illegal trick is spoofing, posting fake orders you never intend to fill, which is a different thing entirely and is punished by regulators.
If you know the Wyckoff method, you will recognize the classic spring: a false break beyond the edge of a range where the big player loads a position against the crowd it just flushed. A liquidity grab and a spring are the same event in different vocabularies. The footprint never changes, only the name on it.
Here is how it looks live. Price holds a range for a week, and under its lower edge, at equal lows, sit the stops of everyone who bought inside. A large buyer cannot build size right there, price would run up before the position is full. So first it presses the market below the lows: stops fire, sell orders flood in, and the buyer absorbs that volume from the panicked crowd. On the surface it looks like a breakdown; underneath, large capital just built a long. Then price turns up and leaves the crowd behind.
In short: A grab, a stop hunt and a sweep are one mechanic at different speeds: stops collected for counter-volume, the same as a Wyckoff spring, given away by a volume spike on the false break.

How to find liquidity zones on a chart
Pools are easier to find than they sound, because they sit in the most obvious places. You mark equal highs and lows, the extremes of the previous session and day, the loud support and resistance lines. Anywhere price left a long wick, or a stop cluster begs to exist, that is where liquidity waits.
Here is the checklist I run. Equal highs and lows: two or three touches of one level almost guarantee a stack of stops beneath it. Previous day and week extremes: the whole market sees them, so the orders there are dense. The boundaries of the Asian session, which London and New York often reach for, clearing liquidity built up overnight. And round psychological numbers, where the crowd parks both targets and stops. The more of these signs land in one zone, the more seriously I take it. A double sweep happens too: price clears a low, then later comes back for the opposite pool above a high, so I keep both edges in mind at once.
The big picture is usually built on higher timeframes, the daily and four-hour, the entry hunted on lower ones. Volume confirms the zone: a spike on the false break means liquidity was genuinely collected. No volume, and price most likely just brushed the level with no interest from large capital.
A word on timeframes, because without it pools turn to mush. I mark the zones themselves on higher charts, the daily and four-hour: pools there are large and meaningful, and the market heads for them on purpose. The entry after a grab I hunt on lower charts, from fifteen minutes to an hour, where the reaction is visible: the return inside a level, the reversal candle, the shift in character. The higher timeframe answers where, the lower one answers when. Stare only at the lower chart and any small false break passes for a grab, and you enter into nothing.
In short: Hunt pools in obvious spots: equal extremes, day and week highs and lows, Asian-session boundaries and round numbers, and let a volume spike on the false break confirm the zone.
How to trade a liquidity grab: the entry
The false break itself is not an entry signal, only a reason to pay attention. Price pierced the level and collected stops, but the trade is always conditional. Wait for the reaction: a reversal candle and a return back inside the range. That is the sign that liquidity is taken and large capital has its volume.
After confirmation, the entry goes with the real move, the stop beyond the extreme of the false break, and the target often sits on the opposite pool, where price will logically reach next. But there is a catch most people miss. Taking liquidity does not always reverse the market: sometimes large capital collects stops to add to a trend already running, and price keeps going the same way after the false break. So you watch not just the false break but where the reaction and volume point. A handy reference after a grab is an order block, the zone price later pushes off from.
Both outcomes deserve a look, because beginners confuse them most. If price quickly returns inside the range and closes back in, that is a reversal: liquidity is taken, and the move runs opposite to the false break. If price cleared the stops and pushed on without a pullback, on rising volume, that is not a reversal but a trend add, and you work with the move. Mixing them up and standing against the trend right after a grab is the typical, expensive mistake.
Now my own approach. I never take a liquidity sweep on its own as an entry signal. My rule has been one thing for years: the false break I watch, the trade stays conditional. I wait for the reaction, a reversal candle and a return into the range, and only then enter toward the true move, stop beyond the extreme of the false break, target at the opposite pool. In my experience the dangerous level is the obvious one, dangerous precisely because it is obvious: the whole crowd parks stops there, so collecting them pays large capital best. That is why I do not place a stop right on the visible high or low; I give it room. This is not advice to you personally, it is my working approach. I am not telling anyone to drop levels, they are the foundation; I only add confirmation by volume and reaction so I do not enter an empty false break. This logic comes straight out of working with levels and the liquidity deficit, and why the volume spike on a false break matters so much is explained by the effort versus result principle. How a liquidity grab looks on a real chart, I show in the clip Smart Money and the liquidity grab.
Let me gather the common mistakes in one place. First: entering right on the false break, before it is clear whether this is a grab or a real breakout. Second: parking a stop exactly on the visible high or low, and handing it to large capital again and again. Third: ignoring volume and reading any break of a level as a sweep, when without a spike it is just an empty touch. Fourth: after a grab, reflexively trading against the move, forgetting that a false break can also be a trend add. All four are cured by one thing: waiting for the reaction rather than the drawing. I went through every one of them early on, so I speak from bruises, not theory.
In short: The false break is not the entry but the cue: wait for the return into the range and the reaction, stop beyond the extreme of the false break, target the opposite pool, and never park your stop on the most obvious level.
Frequently Asked Questions
It is a zone on the chart where a lot of stop orders and pending entries pile up, usually above swing highs and below swing lows. It pulls price in because it hands large capital the volume needed to fill big positions. In plain terms, it is fuel for market moves.
They describe the same thing from slightly different angles. A liquidity grab is the broad act of tapping resting orders to access volume. A stop hunt is the sharp push that triggers a cluster of stops. Both collect orders so large capital gets the counter-volume it needs to fill a position.
A volume spike on the wick beyond the level, then the candle closing back inside it. The spike shows that real orders were filled there. If price false breaks through a level on no volume, that is an empty touch, not a grab, and I leave it alone.
Because the false break was never about going that way. It was about collecting stops and filling a position. Once the volume is in, there is no reason to keep pushing past the level, so price turns toward the real move. Sometimes it continues instead, when large capital is adding to an existing trend.
No, they share a name and nothing else. In trading, a liquidity pool is a zone of stops on the chart that price reaches for. In DeFi, a liquidity pool is a reserve of tokens locked in a smart contract that powers swaps on a decentralized exchange. This article is only about the first meaning.
About the Author
Author: Igor Arapov — independent researcher in the psychology of investment decisions and behavioral finance, practising trader since 2013, founder of arapov.trade, author of a trading book series (ORCID: 0009-0003-0430-778X).