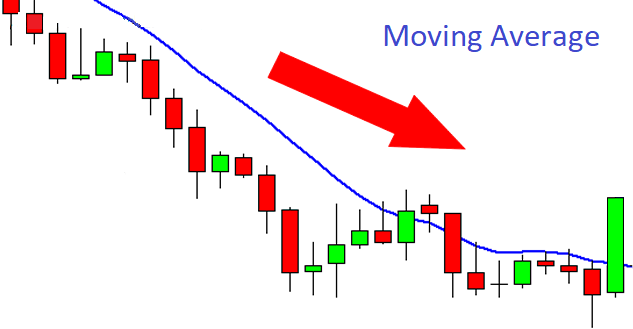
A moving average is a line that averages price over a chosen number of candles and smooths the market noise, showing the general direction of the trend. It comes in a simple form and an exponential one that leans on recent prices. Its defining trait is lag: the line is built from the past, so for active intraday trading it's almost useless, while as a rough filter of the long-term trend it works perfectly well.
The moving average is the best-known indicator in trading, with mountains of books written about it. Let me state my position up front: aside from volume I respect no indicator, and I don't trade off moving averages myself. But the topic can't be skipped, since a beginner runs into it anyway. So here it is calmly: what it is, why moving averages are almost useless for active trading, and where they do bring real value.
In this article we'll cover:
- a moving average is an averaged line of price that smooths noise and shows the trend
- SMA weights prices equally, EMA gives more weight to fresh data and reacts faster
- the main downside is lag, so for intraday trading moving averages are almost useless
- the one real use is a rough filter of the long-term trend for screening stocks into a portfolio
Take it in order: what a moving average even is, why it works poorly for active trading, and where it has an honest use.
What is a moving average, and how SMA differs from EMA
A moving average is a technical indicator that averages price over a chosen number of periods and smooths the swings, helping you see the direction of the trend. The name says it all: with each new candle the calculation window shifts, and the average is recomputed from scratch.
It's a basic tool of technical analysis, trend-following at heart: its job is to show where the market is looking overall. There are several kinds, but two matter in practice. The simple average, the SMA, adds up the closing prices over a period and divides by their count, giving every candle equal weight. The result is the smoothest line, and also the most sluggish. The exponential average, the EMA, gives more weight to recent prices, so it reacts faster, and it's more often placed on short timeframes. The longer the period, the smoother and more inert the line; the 200-day SMA, for instance, is treated as a classic gauge of the global trend. The key thing to grasp at once is that any average is merely the arithmetic of past prices, not a forecast of the future, and all its strength and weakness grow from exactly there. From that follows a simple rule for choosing the period. A short average, say 9 or 20, hugs price and reacts fast, but it's noisier too, throwing more false signals. A long one, like 50 or 200, shows the general course more calmly but turns with a big delay. There's no universal answer for the right period: it all depends on the horizon you work on, and any attempt to fit the perfect number to a past chart is curve-fitting that usually falls apart on future data.
In short: An average is an averaged line of past prices; the SMA is smooth and slow, the EMA faster thanks to the weight on fresh data, but both speak of the past.
Why moving averages don't work for day trading
There's one fundamental reason behind moving averages: lag. Across all my years of practice I've found no use for moving averages in my own trading, and aside from volume I respect no indicator. The line is built from past prices, so it reports a reversal only after it has already happened. For intraday trading, where the decision has to be made here and now, that's almost a death sentence.
Add a range on top of that. The moment the market drifts sideways, price keeps poking back and forth across the average, and the indicator spews a barrage of false signals that make it easy to bleed an account dry. The same goes for the popular crossings like the golden cross and the death cross: on historical charts they look convincing, while in real time they hand you an entry after a large part of the move. So you get a vicious circle: to make the average quieter you lengthen it, but then it lags even more, and to make it react faster you shorten it, and then false signals only multiply. There simply is no ideal setting here. Let me show on a plain example why this hits the account. Say you go long when the fast average crosses the slow one from below. Price jerked, you got in, and three candles later the market pulled back, the averages crossed back, and the signal tells you to exit at a loss. Then another reversal, another entry, another stop. In a range these false crossings come one after another, and each one costs you the spread, the commission and your nerves, and the upshot is a slow bleeding of the account without a single big mistake. I prefer to watch not an averaged line but what actually moves price: volume and the reaction off levels. That's not advice for you, it's how I act. Volume and trend analysis along with working with levels is covered separately. And why lag in particular is the main trouble with moving averages I show in the video on the main problem with moving averages.
In short: An average reports a reversal after the fact, and in a range it scatters false signals, and no ideal setting exists between noise and lag.
Moving averages as dynamic support and resistance
The most popular way people actually trade an average is as a moving floor or ceiling. In a clean uptrend price often pulls back to a short average like the 21 or 50 EMA, touches it, and pushes on, so traders treat that line as dynamic support and buy the touch; in a downtrend the same line caps rallies as dynamic resistance. There is something real beneath this. When enough traders watch the same 21 or 50 EMA, their orders gather around it, and for a while the level genuinely holds, a small self-fulfilling effect that is worth knowing about.
But I read it with care. An average has no memory of why any level ever mattered; it simply slides along under price, so this support is soft and shifts a little with every candle. I would rather mark a real horizontal level, a price where the market actually turned before, and watch the volume there, because that is where orders truly sit. If a moving average happens to line up with such a level, good, it adds a touch of weight, but on its own a bounce off a sliding line is not a reason for me to enter. So I treat dynamic support as context at best, never as the trigger. This is not advice for you, it is how I keep a real level apart from a drawn one.
In short: People trade an average as dynamic support or resistance, buying the pullback to a 21 or 50 EMA; it works partly because everyone watches it, but the line slides every candle, so I treat it as context and trust a real horizontal level and volume instead.
Where moving averages actually help: the 200-day trend filter
It would be dishonest to call moving averages useless altogether. They have one worthy use, and it's tied not to speculation but to long horizons. On big horizons the lag stops getting in the way, because what you care about isn't the entry point but the bare fact: is the market in a rising phase or a falling one.
The classic move is the 200-day SMA as a filter of the global trend. If a stock or an index holds steadily above its 200-day average, that's a bullish regime, and such instruments are worth considering for a long-term portfolio. If price has slipped beneath it, that's a bearish regime, and it's sensible to hold off buying. Here the average works not as a trade signal but as a rough filter of direction, helping to weed out plainly weak assets. Investors have an even rougher but honest method on these same horizons: tracking the relative position of the 50-day and 200-day averages. While the fast one is above the slow one the regime counts as bullish, below it bearish. On a daily horizon that works not as a precise signal but as a general traffic light: red means don't trade against the trend, while green merely lets you look for buys, and you still find the entry itself with a different tool. In short, for me a moving average isn't an entry tool but more of a museum piece: useful to know, not to trade by. I build my work on volume and levels, because they speak of what's happening now, while an average by definition tells of the past. A rear-view mirror is useful, but you don't steer by it. The average shows where the market has already been, yet says nothing about where it will turn next. When a beginner stacks three averages on the chart and waits for signals from them, he's essentially staring into the rear-view mirror and wondering why he keeps hitting a lamppost. But I deliberately won't call moving averages useless, that would be overreach: that honest role of a background filter on big horizons is real, and for an investor it works. Just don't confuse a direction filter with an entry signal, those are different jobs. The principle itself, why price-derived indicators lag, I unpack in the section on indicators in trading.
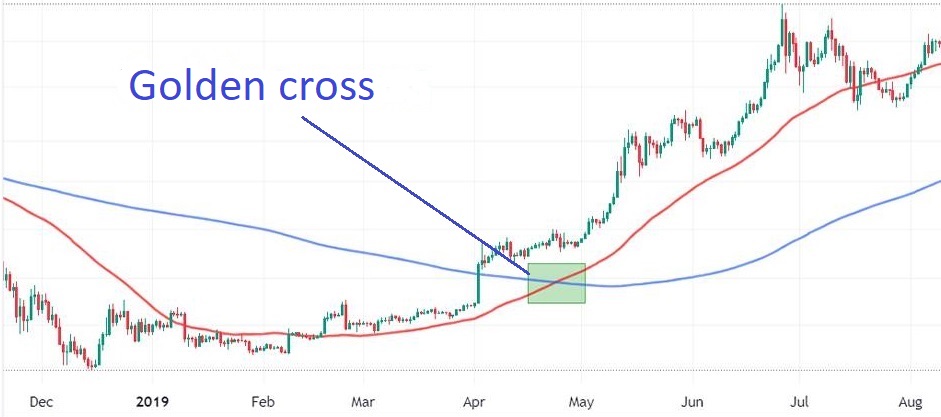
Since we are on the rough trend filter, two crossings are worth naming because people search for them by name. The golden cross is when the fast average, usually over 50 periods, crosses the slow one over 200 from below: the market reads it as a shift into a long-term rise. The death cross is the mirror, the fast drops under the slow, and that is read as a turn down. It sounds grand, but remember the nature of an average: both crosses are built from long-closed prices and therefore lag badly, by the time of a golden cross a sizeable part of the move is already behind. I do not enter on the cross itself, for me it is only a rough mark of the regime on a higher scale, and the decision still rests on the level and volume.
In short: The one honest role of an average is a rough trend filter on long horizons, such as the 200-day SMA, but as an entry signal it's no good.
Frequently asked questions
It's a line that averages price over a chosen number of candles and smooths the market noise, showing the general direction of the trend. With each new candle the calculation window shifts and the average is recomputed.
SMA averages prices equally and gives the smoothest but slowest line. EMA puts more weight on recent prices, so it reacts faster. SMA is handier for a long-term trend, EMA for short timeframes, but both lag.
Many traders do: in an uptrend price often pulls back to a 21 or 50 EMA and bounces, so the line is treated as dynamic support, and as dynamic resistance in a downtrend. It works partly because everyone watches the same average, but the line slides every candle, so I treat it as context and trust a real horizontal level with volume instead.
Because of lag: the line is built from past prices and reports a reversal only after it has already happened. And in a range, price keeps crossing the average, throwing off a stream of false signals.
They're popular moving-average crossover signals, but they lag heavily. On historical charts they look convincing, while in real time they give an entry after a large part of the move is done, so leaning on them alone is unwise.
On long horizons. The 200-day SMA works as a rough filter of the global trend: price above it is a bullish regime, below it bearish. That helps screen stocks for a long-term portfolio, but it's no good as a signal to enter a trade.
About the Author
Author: Igor Arapov — independent researcher in the psychology of investment decisions and behavioral finance, practising trader since 2013, founder of arapov.trade, author of a trading book series (ORCID: 0009-0003-0430-778X).