VWAP is the average price of a session, weighted by volume. It shows the price at which the bulk of the day's trades actually went through from the open, and so it serves as a fair-value reference for large players. In my experience VWAP is more useful than the usual oscillators, because volume is baked into it, but it's not worth treating it as a one-size-fits-all tool.
Of all the indicators, VWAP is the one I'm most comfortable with, and the reason is simple. I've traded off volume for a long time, and VWAP is just about the only popular line that actually accounts for volume rather than recomputing price alone. So here it is without my usual skepticism: what kind of average it is, why big money tracks it, and how to use it together with volume analysis.
In this article we'll cover:
- VWAP is the volume-weighted average price of the day, showing where the main capital traded;
- institutions measure execution quality against it, so the level becomes self-reinforcing;
- price above VWAP is a buyers' edge for the session, below VWAP a sellers' edge;
- in my experience VWAP is strongest where it lines up with a real level and a volume cluster.
Start with how this average is even calculated and how it differs from the usual ones.
What is VWAP (volume-weighted average price)
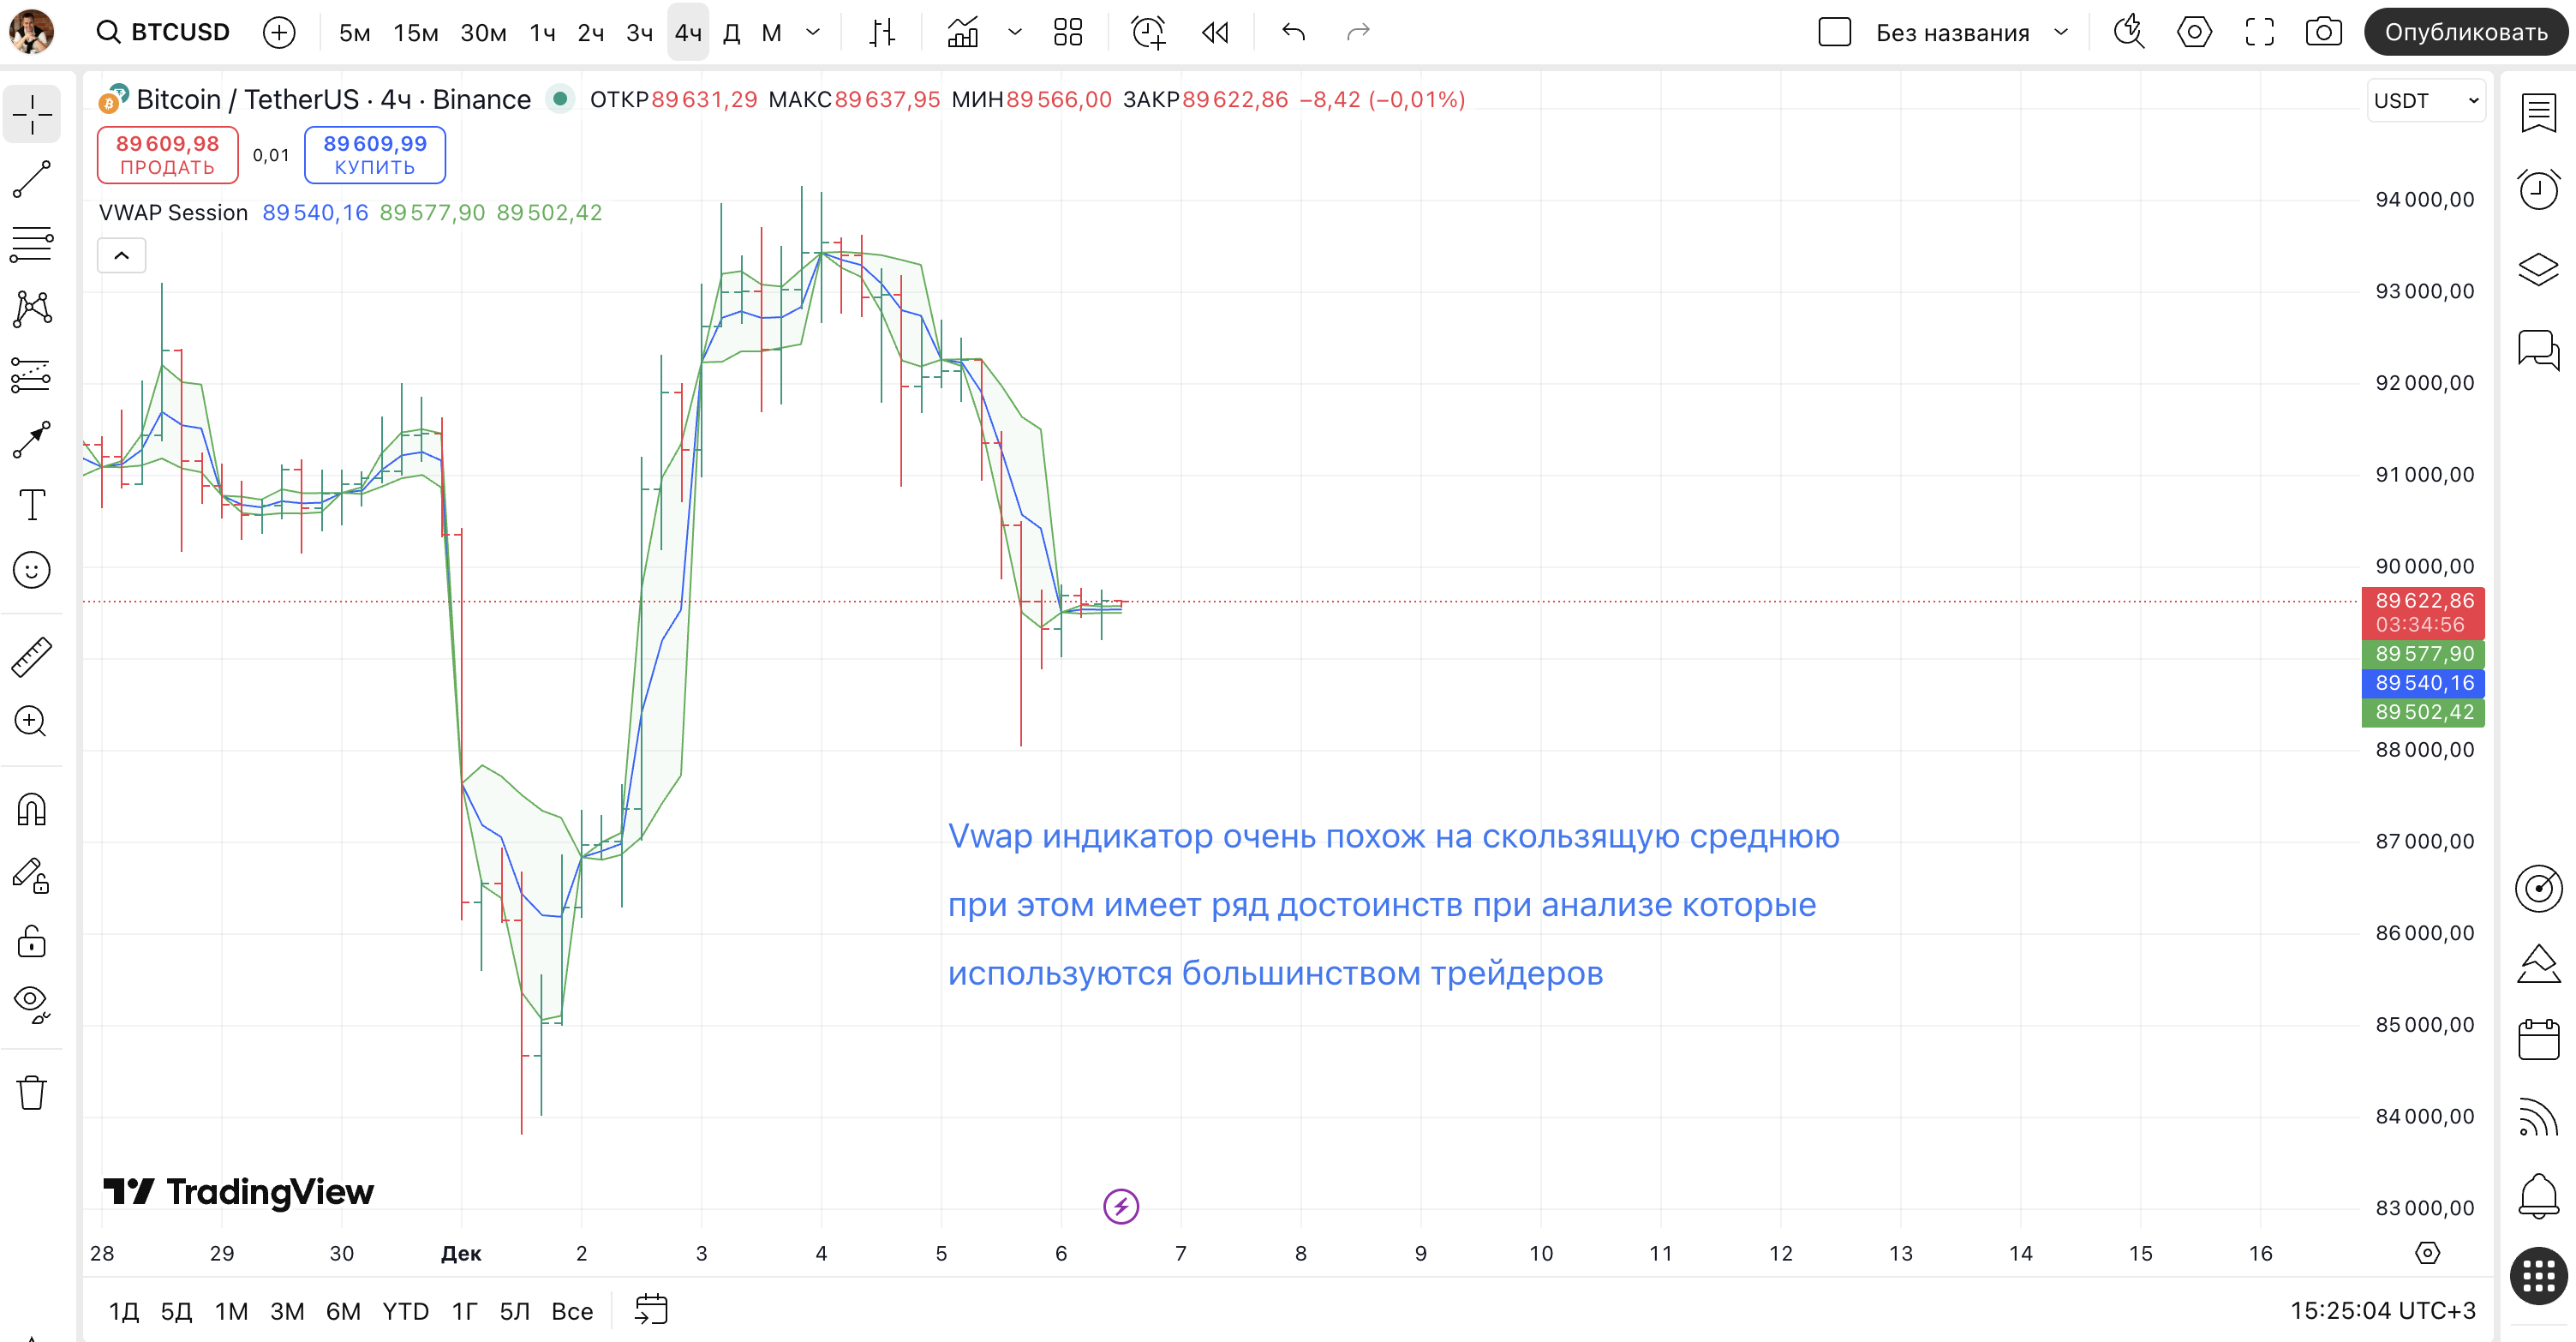
VWAP is the volume-weighted average price, that is the sum of each bar's typical price multiplied by its volume, divided by the total volume since the session opened. The typical price is usually taken as the average of the high, the low and the close.
The key difference from an ordinary moving average is that VWAP accounts not only for price but for volume too. Where a lot of trades went through, that price carries more weight. VWAP is counted cumulatively from the open and resets every day, which makes it primarily an intraday tool. At the start of the session the line jerks with every trade, and by the end of the day it settles down, because a large volume has accumulated. In practice it's a slice of the price that was actually traded, and how to read exchange volume itself I cover separately. It's the same logic as in the market volume analysis in the course. There's also an anchored VWAP, started not from the open but from a point you pick, a swing low or a news event, which carries the same idea onto longer horizons.
In short: VWAP is the volume-weighted average price from the session open: where more trades went through, that price weighs more; it's counted cumulatively and resets each day, so it's primarily an intraday tool.
How institutions use VWAP when entering a position
Here is the reason VWAP works as a level at all. A large fund can't buy a big size with one order, or it would push the price up itself. So the execution is stretched out and then graded against VWAP: bought on average below the day's VWAP is good execution, above it poor. Algorithms openly try to build the position around this average.
What kicks in next is simple mechanics, not magic. Those who bought above VWAP are sitting at a loss and are glad to get out at breakeven on a pullback to the average, creating pressure. Those who sold below it, the reverse. That's why price returns to VWAP and bounces off it so often. For me the value is that VWAP is a visible footprint of where large capital worked, and tracking what smart money does is the very core of the volume method.
In short: A large fund stretches its execution and grades it against VWAP, so algorithms build the position around the average; those who bought above are glad to exit at breakeven on a pullback, and because of that price returns to VWAP so often.
VWAP as intraday support and resistance
Reading it here is straightforward. If price holds above VWAP, the edge is with the buyers, and pullbacks to the line I'd view as zones of buyer interest. If below, the edge is with the sellers, and bounces to VWAP are seller zones. When price churns right on VWAP, that's balance, and there's little point getting into such a choppy market.
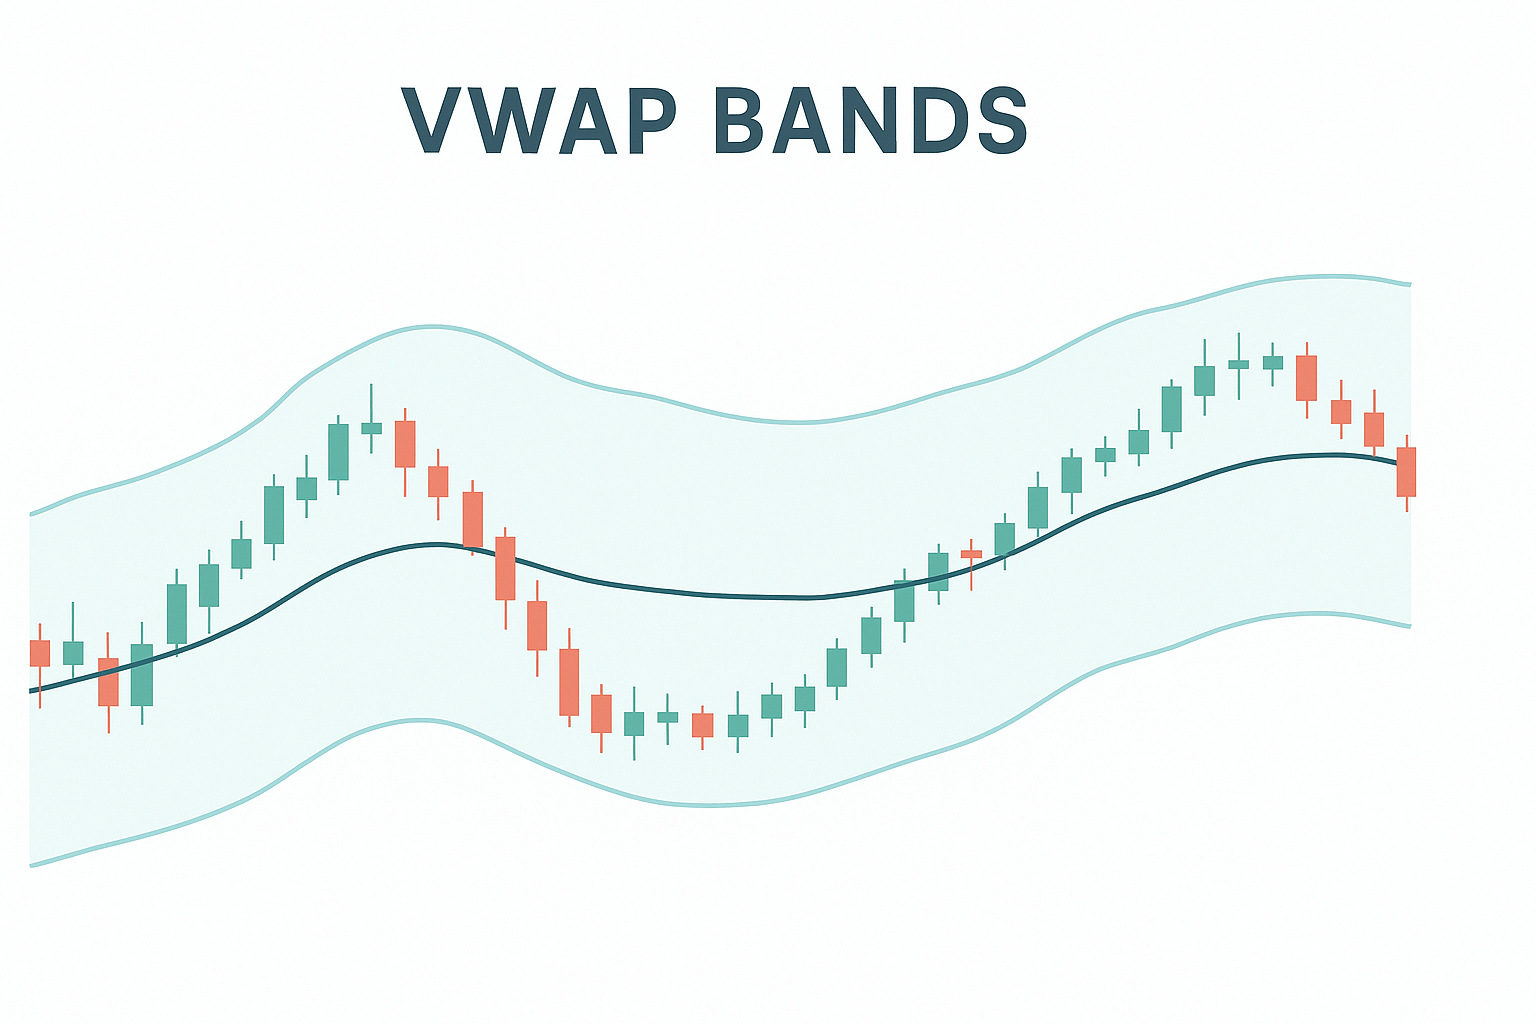
Many platforms also draw VWAP bands at one, two and three standard deviations from VWAP. The idea is that a move beyond the second or third band is a statistically strong deviation, and from there price is often pulled back toward the average. The approach works, but this is exactly where beginners stumble: they start mechanically selling at the upper band and buying at the lower one, as if it were an automatic signal. In my experience the bands are a hint about being stretched, not a ready signal, and without confirmation from volume I wouldn't enter off them.
In short: Price above VWAP is a buyers' edge, below it a sellers' edge, on the line itself balance; the bands of one to three deviations hint at being stretched, but that's not a button, and without volume confirmation I don't enter off them.
Trade VWAP in practice: the first 15 minutes, liquid names, and the reclaim
A line built from volume is only as trustworthy as the volume under it, and that carries a few practical consequences worth knowing before you lean on VWAP. In the first fifteen or twenty minutes of a session it is almost useless: so little volume has piled up that a single large trade yanks the line around, and it steadies only as the day fills in. It also needs a liquid, actively traded instrument; on a thin name the average is built from next to nothing and the level simply will not hold. The chart most traders watch it on is the five-minute, granular enough to see how price interacts with the line without drowning in the noise of the one-minute.
The cleaner read, in my experience, is not the bare touch of the line but the reclaim or the rejection. When price has spent the session below VWAP and then pushes back above it and holds, that reclaim says control is passing to the buyers; the mirror, a clean rejection from below, says sellers are defending the average. And here the rule is the same one I keep coming back to: a reclaim that arrives with a jump in volume is worth my attention, while a reclaim on thin volume is usually an exhale that fades back. VWAP hands me the reference, the volume tells me whether the move through it is real.
In short: VWAP is unreliable in the first 15-20 minutes and on thin names, and the five-minute chart is its usual home; rather than the bare touch, I read the reclaim or rejection of the line and let the volume on it decide whether the move is real.
Anchored VWAP: anchoring to an event instead of a daily reset
A regular VWAP counts from the day's open and resets every session, so it only describes the current day. An anchored VWAP counts not from the open but from a point you choose yourself, and it does not reset. You usually drop the anchor on a meaningful event: a swing low or high, the day of a major news release or earnings report, the open of the week or month, the start of a clear move. From there the line accumulates volume from that point on.
The value is that you see the average price of everyone who has traded since the event. If price holds above the anchored VWAP after an important low, buyers from that start are in profit and control the move; a drop below the line says the average participant since the event is now underwater. For swing trading on higher timeframes this is more useful than the daily VWAP, which has nothing to do with a weekly swing. I treat it the same way as the daily one: it highlights a fair price from a reference point rather than giving a signal, and only an overlap with volume and a level gives it weight.
In short: An anchored VWAP is the same VWAP but measured from a chosen point (a swing, news, the week's open) and with no daily reset, so it works for swing trading on higher timeframes, not only intraday.
VWAP and volume analysis: using them together
This is where VWAP comes into its own. On its own it's a single average line, and like any average it describes what has already happened. The strength appears when VWAP coincides with other footprints of large capital. If a VWAP level overlaps a horizontal level where price turned before, and a large volume arrives there too, that's no longer just a line but a zone where three confirmations converge at once.
That's exactly how I look at VWAP. On CME futures, where the volume is exchange-traded and honest, the average often turns out to be right where I see a cluster of volume even without it. In other words VWAP doesn't open a new market for me, but it conveniently highlights the session's fair price. This isn't advice for you personally, it's how I work: VWAP comes as an add-on to volume and levels, not in place of them. Close to this lies the reading of the market profile, Steidlmayer's analysis. And why volume is the cause of a move while indicators are only the consequence is covered in the section on effort and result.
In short: VWAP's strength appears at a coincidence with a horizontal level and a large volume, where three confirmations converge; for me it's an add-on to volume and levels that conveniently highlights the session's fair price, not a separate system.
Where VWAP fits into the overall picture of reading the chart, I cover separately.
Frequently asked questions
The average price of the day adjusted for volume: the price at which the bulk of trades actually went through from the session open. Price above it means buyers on average paid more than the average, below it means less.
A moving average counts only prices and weights them equally or exponentially. VWAP adds volume: bars where trading was busier weigh more. So VWAP reflects more accurately where the mass of participants actually was.
Classically it's an intraday tool: it's counted from the session open and resets daily, so it comes into its own on stocks and futures with clear volume. There's also an anchored VWAP from a chosen point, which extends its use to longer horizons.
Because VWAP is cumulative from the open, so early in the session almost no volume has accumulated and every trade swings the line sharply. It only becomes a stable reference once enough volume builds through the day, which is why many traders ignore VWAP readings until the first 15-20 minutes have passed.
VWAP is a reference, not a ready-made system. In my experience it's weak on its own, since it's still an average of past trades. I confirm it with real volume and levels, and then it earns its keep.
A regular VWAP counts from the session open and resets every day, so it is intraday. An anchored VWAP is tied to a chosen point (a swing low, news, the week's open) and does not reset, so it suits swing trading on higher timeframes. The logic is the same; only the starting point changes.
About the Author
Author: Igor Arapov — independent researcher in the psychology of investment decisions and behavioral finance, practising trader since 2013, founder of arapov.trade, author of a trading book series (ORCID: 0009-0003-0430-778X).