Gold, oil and stock indices are assets different in essence, but for a trader one thing makes them kin: high volatility and the fact that all of them are traded through derivatives on regulated exchanges. These are my core markets. Gold and the Nasdaq futures I trade myself, on the CME, and I read them by honest exchange volume and levels rather than by indicators. The method I have is the same for all three, but the character and the risk of each are its own.
About these instruments the web is full of general words and the advertising of CFD brokers, while I'm closer to first-hand practice. Let's gather the essence on the three assets in one place at once: what gold XAU/USD is and through what it is taken, how the oil grades WTI and Brent differ from each other, how stock indices like the S&P 500 and Nasdaq are built, and why I approach all three with one method and reduced risk.
In this article we'll cover:
- gold goes under the ticker XAU/USD, this is the price of an ounce in dollars and a long-standing safe-haven asset;
- oil is available through futures on WTI (NYMEX) and Brent (ICE), and the grades diverge in price;
- an index gathers stocks into a basket, and the method of its calculation sets whose influence weighs more;
- volatility is high in all three, which is why the risk per trade I cut below the usual.
Let's start with gold, my main instrument.
Trading gold XAU/USD: a safe-haven asset and CME volume
XAU/USD is the value of a troy ounce of gold expressed in US dollars, the main ticker of the gold market. It is available almost the whole day, five days a week, and gold has a long-standing reputation as a refuge: as soon as instability arrives, capital flows into it.
The fundamental backdrop of gold is worth keeping in mind, but not as a button for an entry. Its main driver is Fed policy and real rates: gold pays no interest, so at high rates it loses to bonds, and at low rates it shines again. Add to this the inverse link with the dollar, demand for protection in crises and central-bank purchases. But the entry itself I look for not by this backdrop, but by the chart. Gold I trade through futures on the CME, because there the real volume is visible, and I read it by the Wyckoff method: I look at the market phase, I search for accumulation, when large capital quietly builds up at support, and distribution, when it unloads at resistance. If a level is broken on big volume and price has held, I believe the move; if the volume is big but price goes nowhere, then a transfer from hand to hand is underway and a reversal is closer. A live example of such work on gold I show in the video on the liquidity grab on the example of gold.
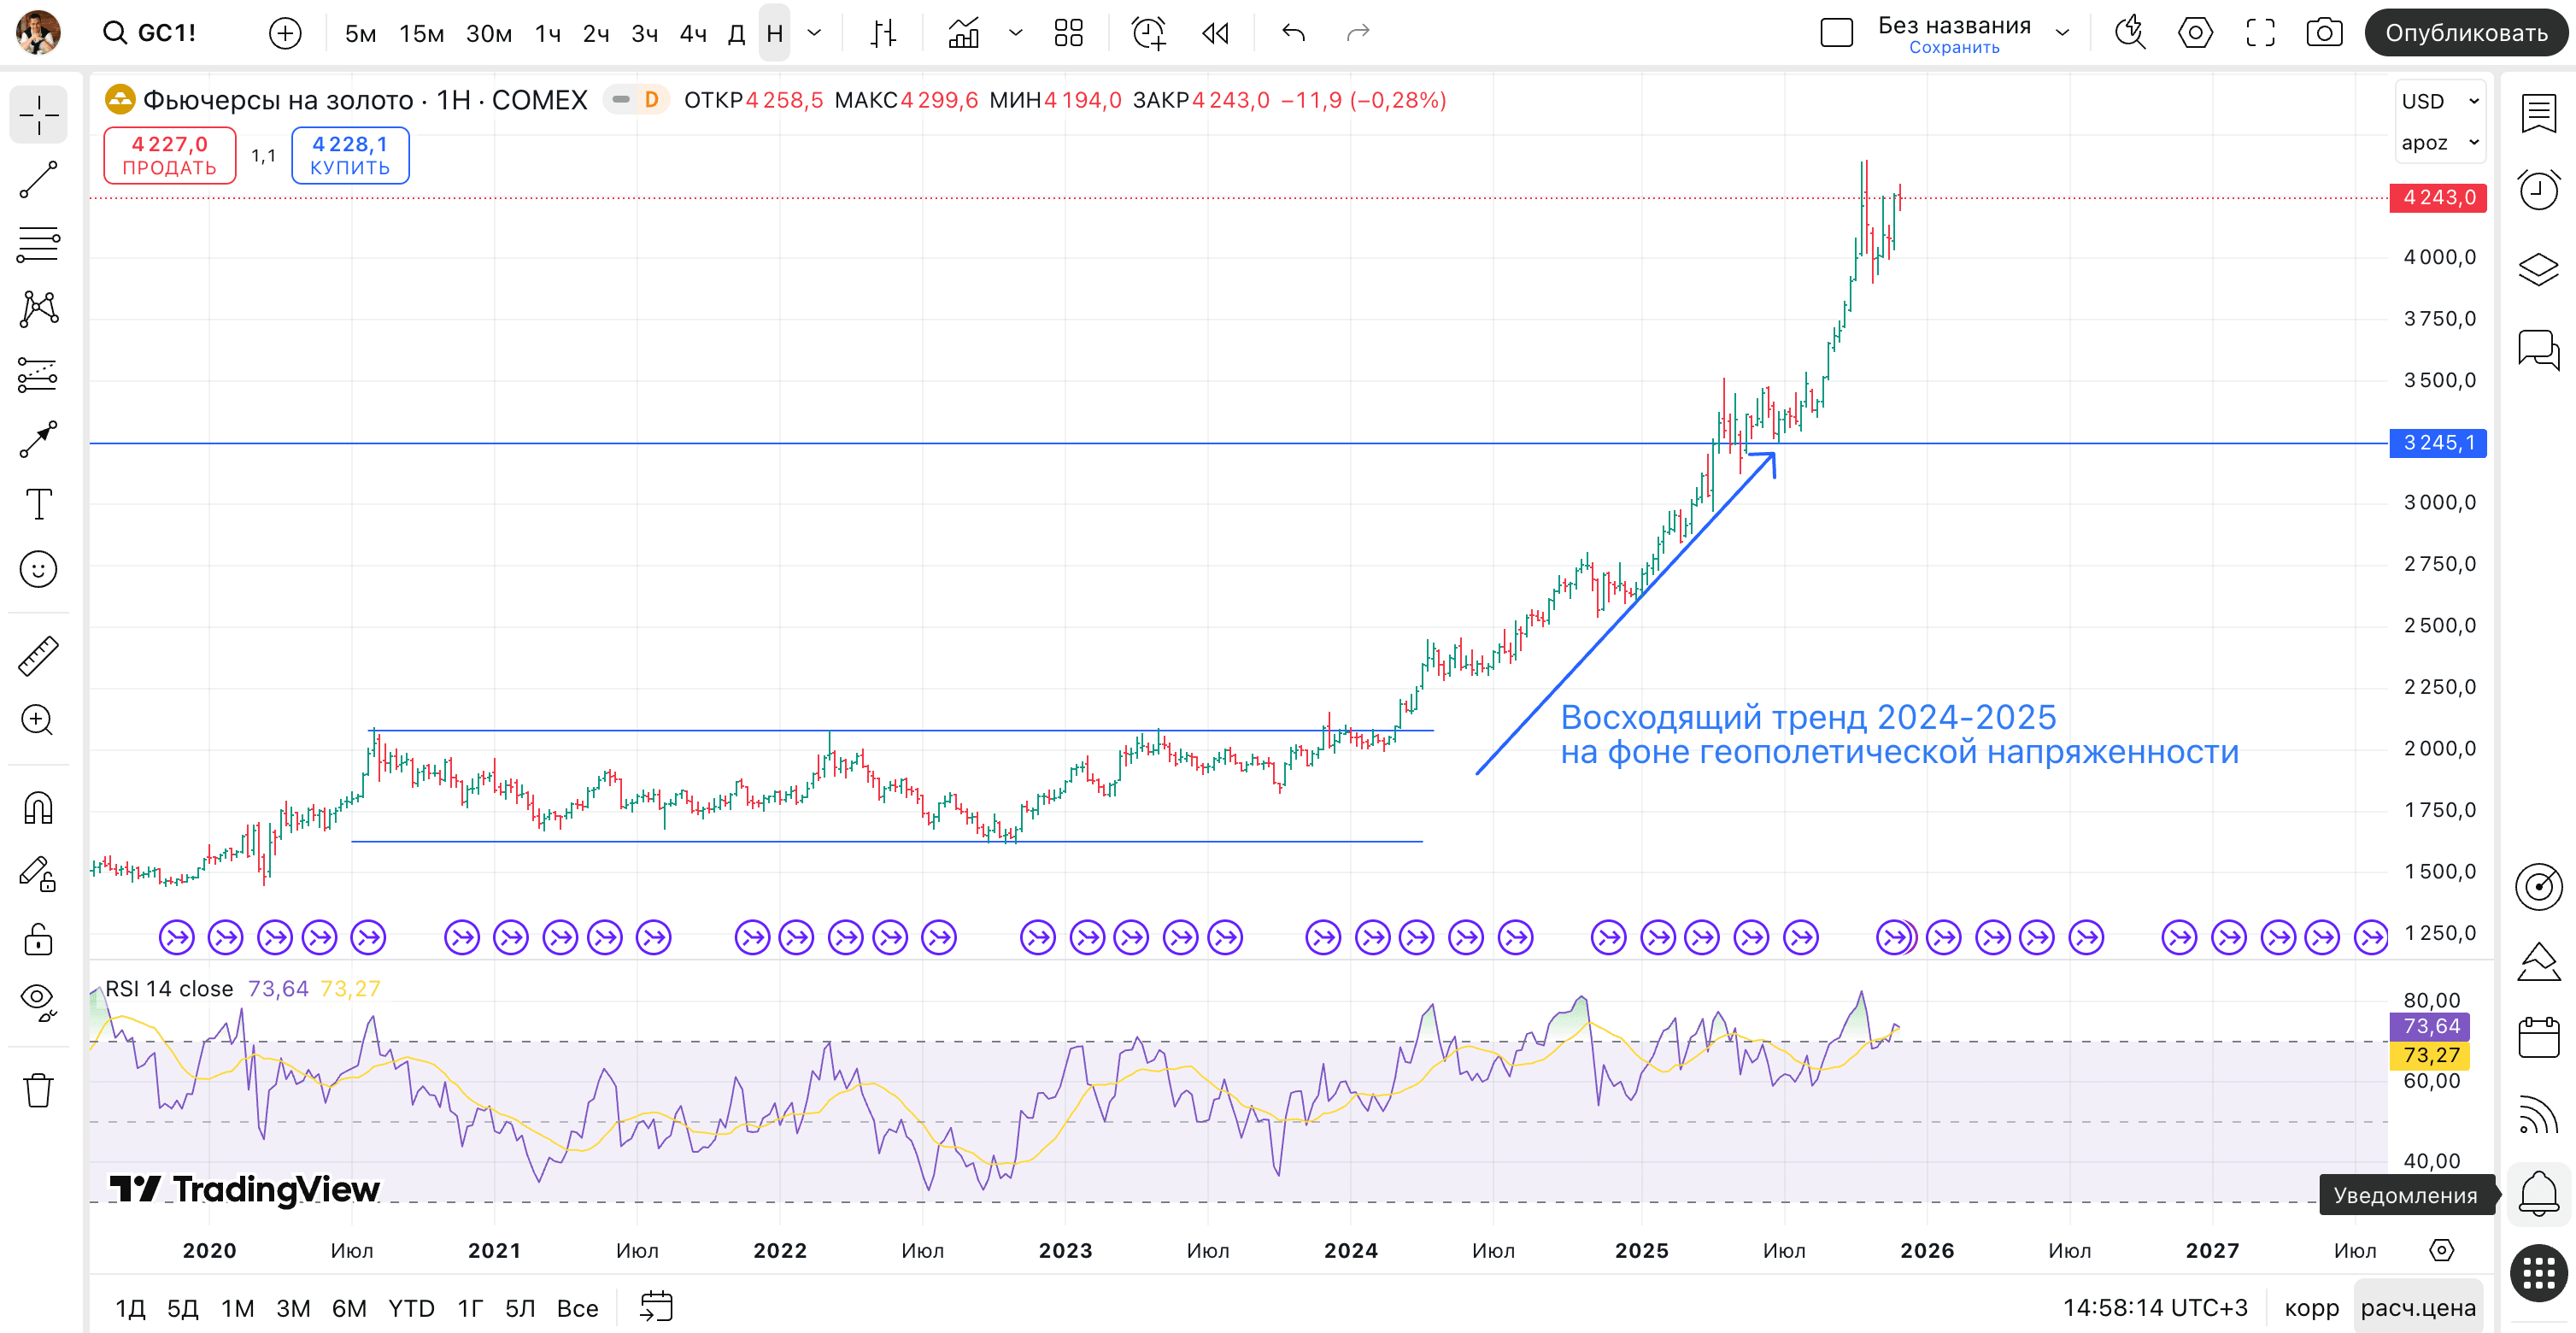
Separately on levels and risk, and this is my practice, not advice to you personally. Gold respects large psychological marks surprisingly clearly, round numbers per ounce and historical extremes: near them orders pile up, and price reacts predictably, either a bounce or a breakout with acceleration. Only it moves in jerks, the swing over a day is often in the tens of dollars per ounce, so on gold I set aside about half a percent of the account per trade and place the stop further away, under that swing. A tight stop on gold is a ticket to a premature exit. How to build and work such levels correctly is taken apart in the course section on working with levels.
In short: XAU/USD is the price of an ounce of gold in dollars, a safe-haven asset with rates set by the Fed as its driver; I read it by the volume of CME futures and round levels, and the risk, because of the sharp moves, I keep around half a percent.
Trading oil: WTI, Brent and the factors of price
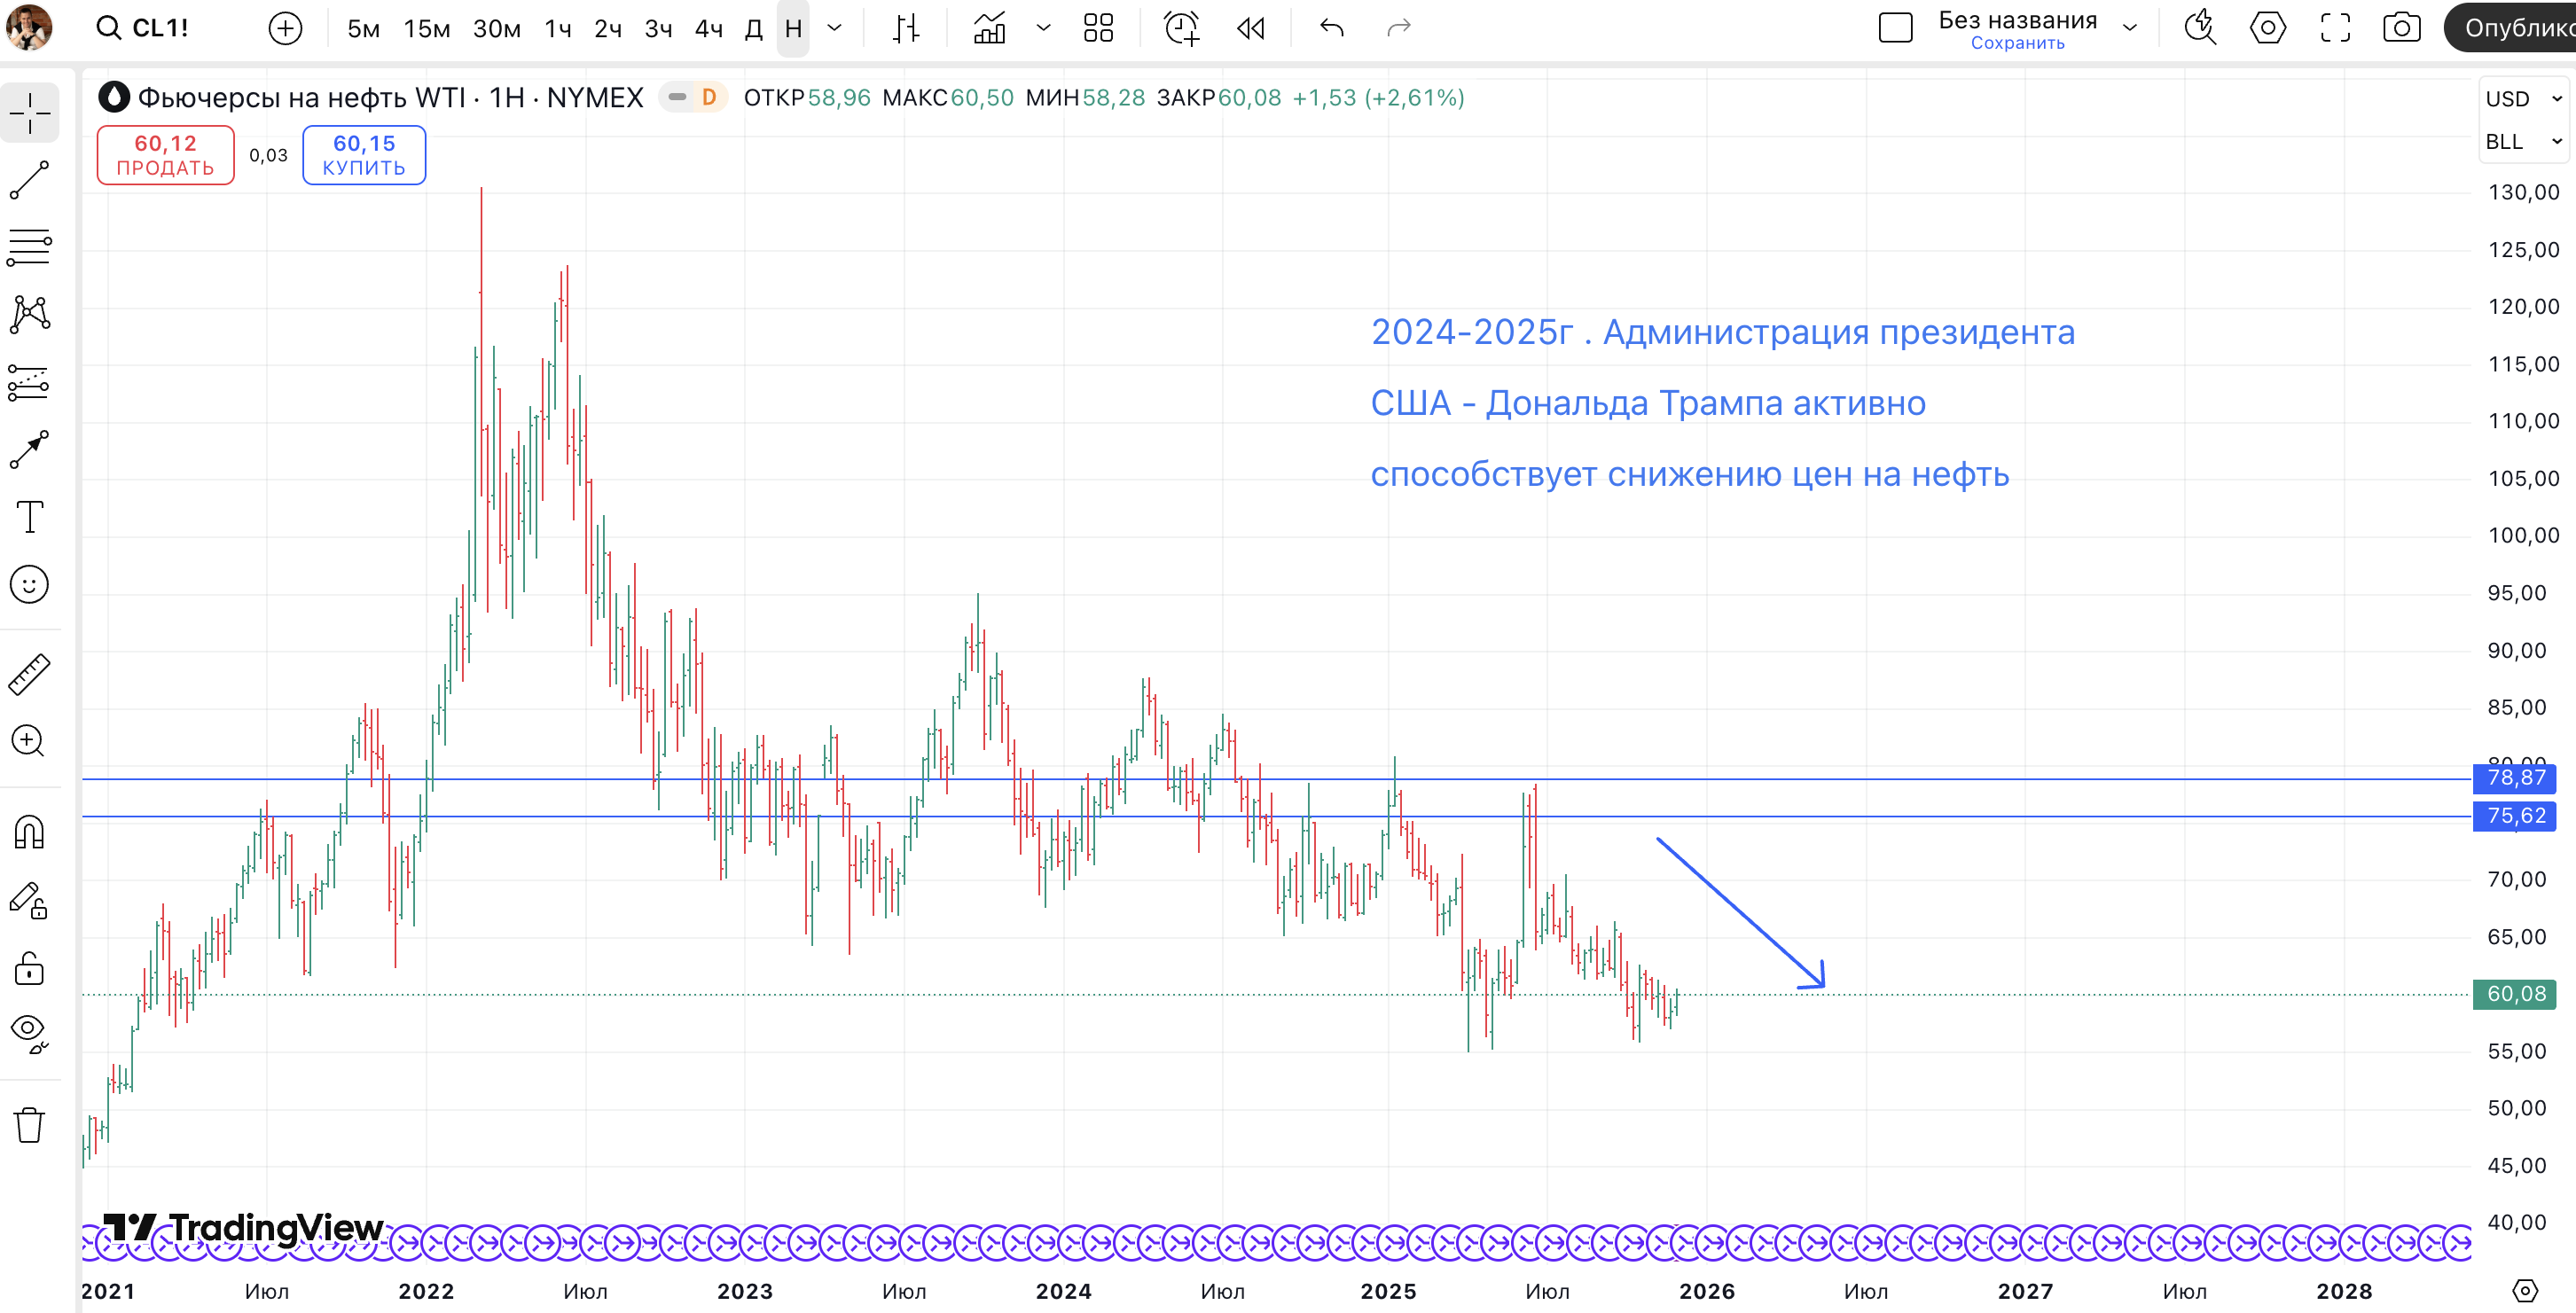
Oil is one of the most nervous markets: geopolitics can move the price by percentages in a day. The trader does not get the physical commodity, he speculates on the price through derivatives. The main instrument is futures: the CL contract on the WTI grade trades on the NYMEX, the Brent contract on ICE, both are liquid and give honest exchange volume, for the sake of which I work with them at all. In parallel forex brokers offer CFDs with a low entry threshold, but that is already an over-the-counter story, with leverage and a wider spread.
It is important not to confuse the two benchmark grades. WTI is the American light low-sulphur grade, the delivery point is Cushing in Oklahoma, the trading venue is the NYMEX. Brent is pumped in the North Sea and traded on ICE, and it is exactly the one that sets the world benchmark: about two thirds of contracts in the world are tied to it, and its price tag is usually a little higher than WTI's. The Brent-WTI spread is the difference in price between the two grades, and it reflects regional imbalances of supply and demand. Experienced traders trade the spread itself too, but for a beginner it is too early there: it is wiser to take one grade, more often WTI, and calmly study its character.
The price of oil is above all the balance of supply and demand. OPEC+ rules the supply side, an alliance with roughly forty percent of world production, which by quotas regulates the volume of oil on the market: any of its decisions moves the price by dollars a barrel. Alongside is geopolitics, threats to supplies at key maritime straits, and the weekly US inventory data from the EIA, usually on Wednesdays. I use all of this as a backdrop, not as a signal: to second-guess OPEC for a private trader is a lottery. I wait for the dust to settle and read the reaction of large capital by the chart and the volume. The link of general economic factors with the price of such assets is taken apart in the material on fundamental analysis.
In short: Oil is available through CL futures on WTI (NYMEX) and Brent (ICE), and the gap between the grades is called the Brent-WTI spread; the price is driven by demand, OPEC+ quotas and geopolitics, but for me that is a backdrop, the entry I take by volume.
Stock indices S&P 500, Nasdaq and DAX: what they are and how they're traded
A stock index is a weight-averaged indicator of the quotes of the stocks that make it up, reducing the dynamics of a whole market to a single number. There is no need to keep a hundred securities in view: one figure already says where the market is leaning, which is why an index has been nicknamed a barometer of the economy.
Most important of all is the method of calculation, because on it depends who pulls the index. With price weighting a more expensive stock influences it more strongly, that is how the Dow Jones and the Japanese Nikkei are counted. With capitalisation weighting the real size of the business goes into the count, and that is how the S&P 500 is built: its five hundred corporations from all sectors cover on the order of eighty percent of the US market, and the share of technology is close to a third, which is why two or three tech giants move the whole figure. The Dow, meanwhile, is the oldest, from 1896, and it has only thirty companies. The Nasdaq is focused on technology, so it is the most volatile of the American ones. In Europe the main benchmark is the German DAX, the forty largest companies of Germany. And one practical rule: the American indices lead the rest of the world, a strong evening move of the S&P 500 by the morning is reflected in Asia and Europe.
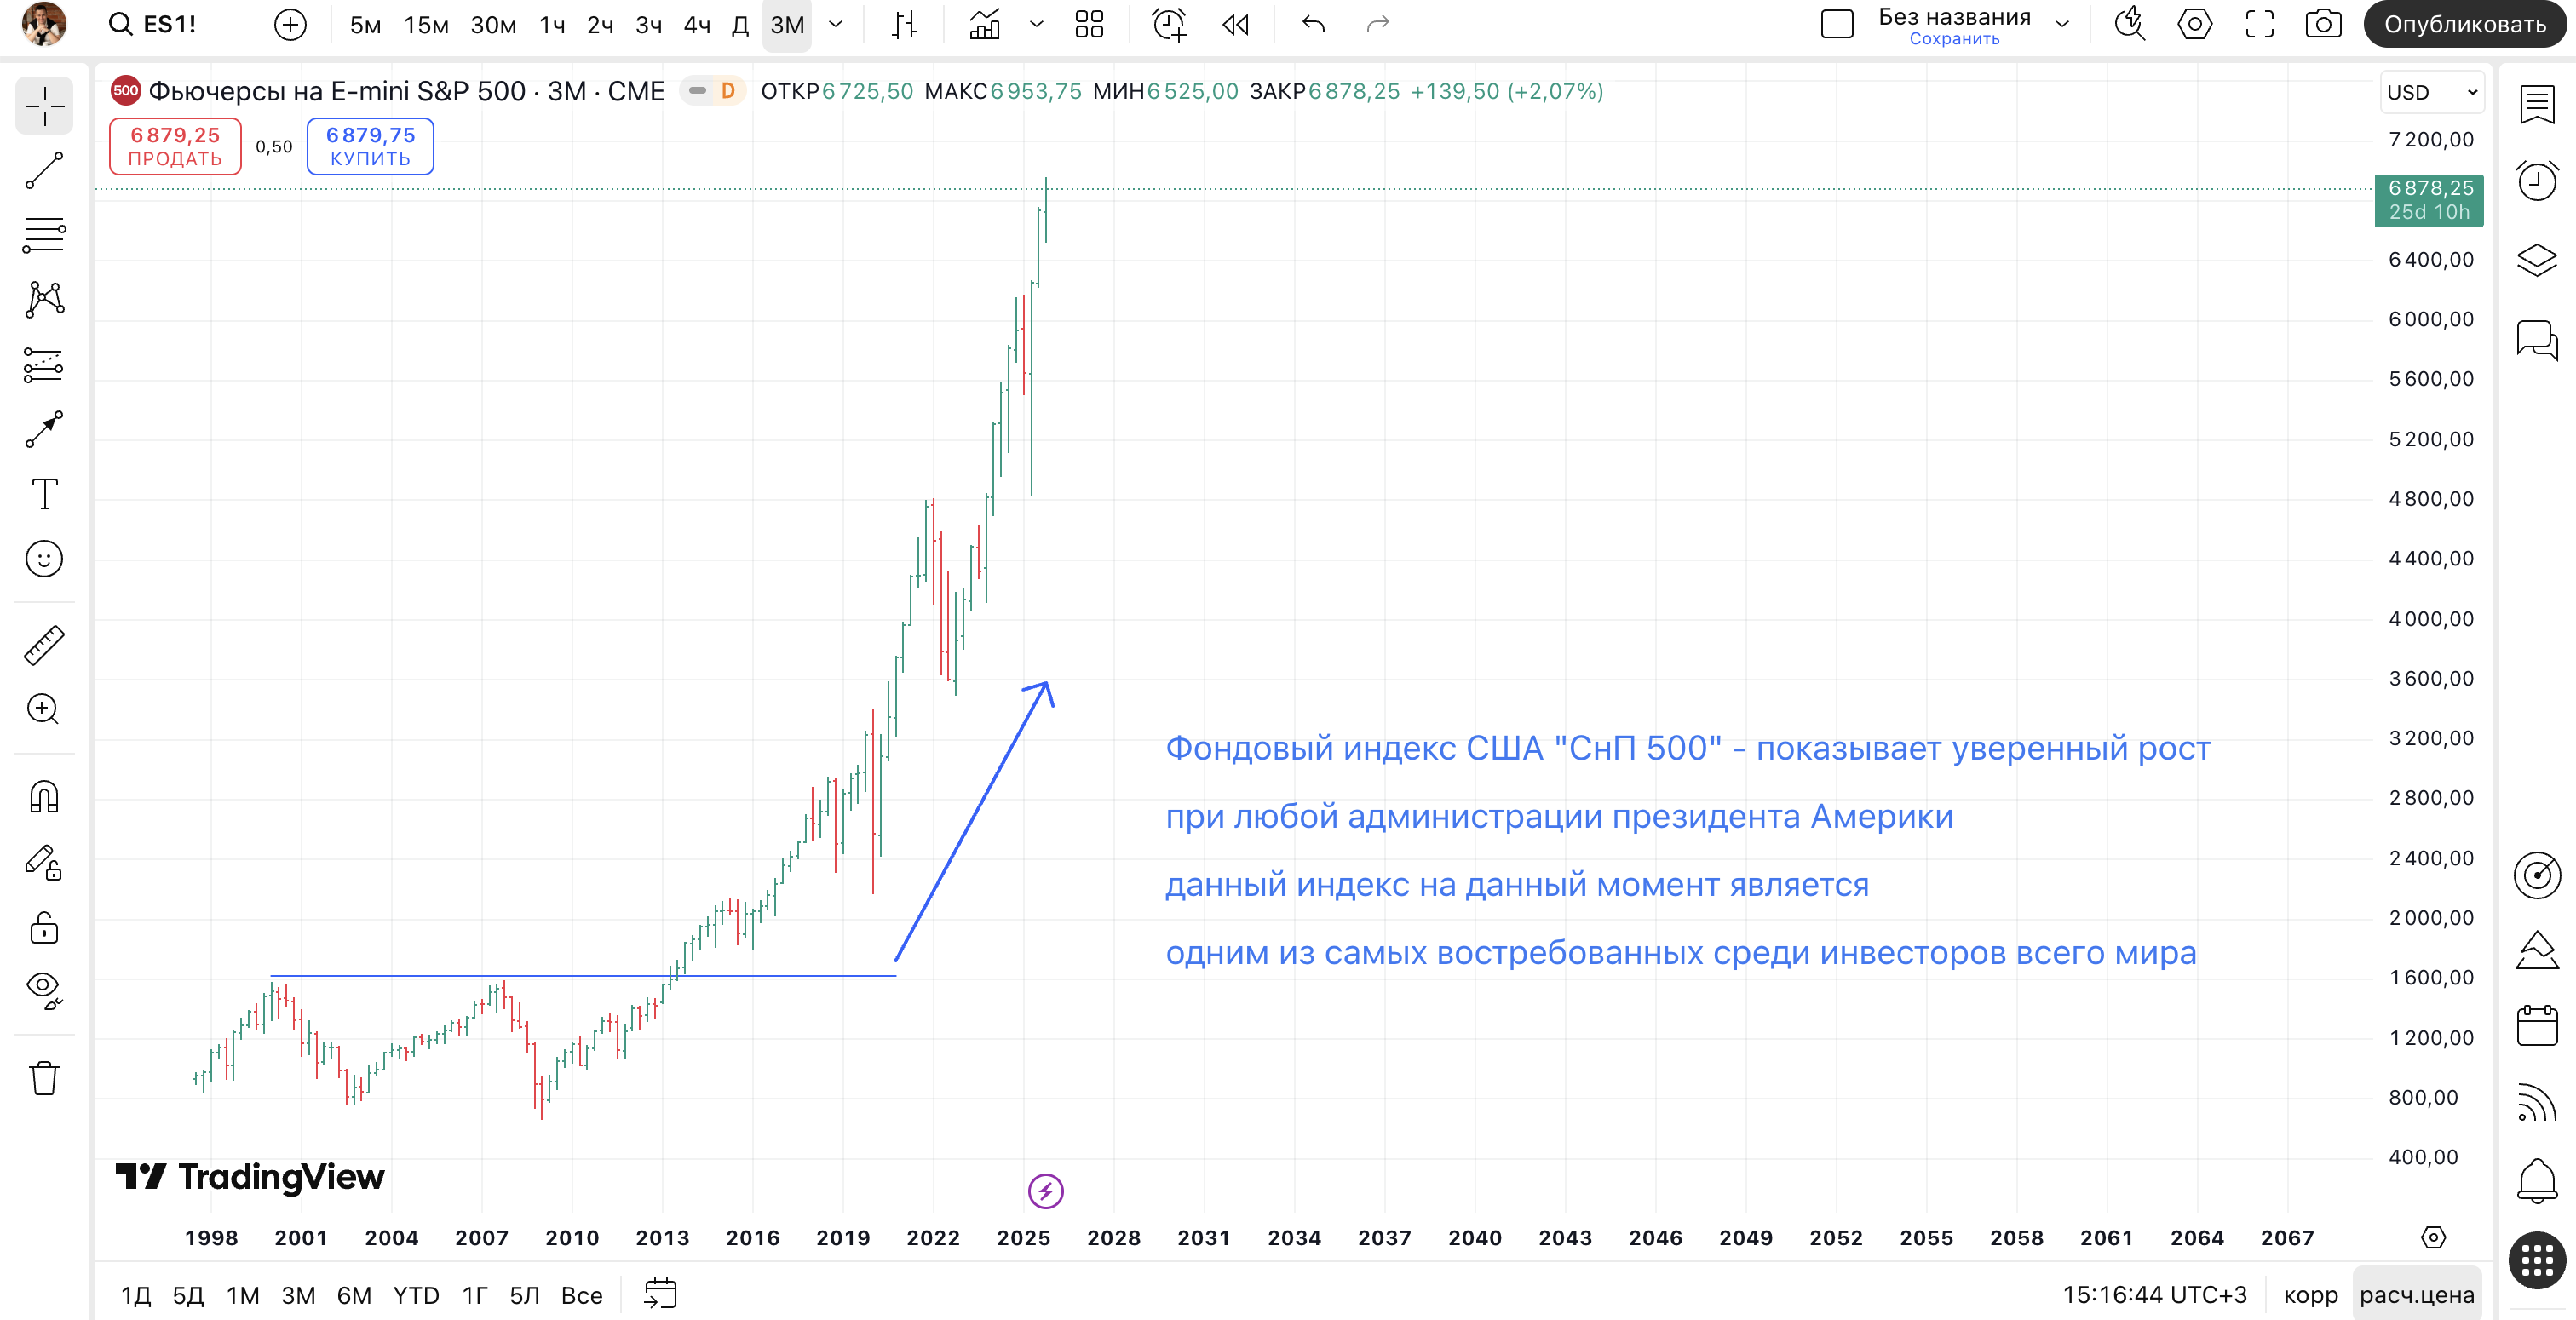
The index itself is only a number, you cannot buy it, it is traded with derivatives. For a long-term investor index ETFs are simpler: SPY repeats the S&P 500, QQQ repeats the Nasdaq, and one such fund at once gives diversification across hundreds of securities. For active trading there are futures: the E-mini on the S&P 500 and on the Nasdaq are among the most liquid contracts on the planet, and for a modest account there are micro versions like the MES. Separately I warn about leveraged ETFs, which amplify the move by two or three times: because of the daily re-pricing, on a long hold they undermine the value even in a sideways range, and for a beginner that is an unnoticed trap. How the futures trading itself is built is taken apart in the material on futures, derivatives and spot.
In short: An index is a basket of stocks in one number; the Dow and Nikkei count by the price of the stock, the S&P 500 by capitalisation, while the Nasdaq is the most volatile of all; they are taken through ETFs (SPY, QQQ) and E-mini futures, whereas leveraged ETFs undermine the account over the long run.
One method and risk: why I read these assets the same way
Different in appearance, gold, oil and indices I run by one and the same principle, and in that lies the convenience. The method is everywhere the same: levels, volume and a false break, with no discount for whether before us is a metal, a commodity or an index. A futures on a regulated exchange, be it the CME, NYMEX or ICE, gives a real flow of trades, and by it you can see where large capital really entered and exited. That is exactly why I choose exchange futures rather than over-the-counter CFDs: on a CFD the volume is drawn and the spread is wider. First I see the market's reaction, and only then do I enter, this rule does not change from instrument to instrument.
What really changes from asset to asset is the size of the risk and the behaviour on news. All three instruments are skittish, a move of a couple or three percent in a day is an ordinary thing for them, so the share of risk per trade I lower to about half a percent and set the stop with a margin. A piece of news, be it a Fed decision, a tech giant's report or an oil-inventory summary, I do not guess in advance, but wait for the market to react to it, and I read that reaction by volume. And one more thing about leverage: in futures and even more so in CFDs it is built in and accelerates not only the profit but also the draining of the account, so a beginner I advise not to get carried away with it. Why I lean on volume at all is taken apart in detail in the course section on volume analysis, and how to build and read the levels themselves on the chart, in the material on reading the chart.
In short: Gold, oil and indices I read the same way, by levels, volume and a false break on exchange futures rather than on CFDs; news I keep as a backdrop, the risk because of the volatility around half a percent, and leverage I don't advise a beginner.
Frequently asked questions
That is how the price of a troy ounce of gold in US dollars is denoted, the main ticker of the gold market. It is available almost around the clock five days a week, and gold has long served as a shelter for capital in troubled times.
WTI is light, low-sulphur US oil with delivery at Cushing on the NYMEX exchange. Brent is extracted in the North Sea and traded on ICE, it is the global benchmark to which about two thirds of contracts are tied; it usually costs a little more than WTI, and the gap between them is called the Brent-WTI spread.
That is the name for a basket of stocks of a group of companies, whose dynamics one figure conveys. You don't have to follow a hundred securities separately: the index shows at once whether the market is rising or falling, which is why it is called a barometer of the economy.
NASDAQ has a strong technology skew and almost no financial sector, which is why it is livelier. The S&P 500 is built wider, holds five hundred of the largest companies from all industries and is counted by capitalisation, which makes it smoother as an indicator.
Below the usual. Gold and oil move in jerks, a swing of several percent in a day is the norm for them, so on a trade I set aside about half a percent of the account and place the stop with a margin for the swings; too tight a stop on such an asset flies out on ordinary noise.
About the Author
Author: Igor Arapov — independent researcher in the psychology of investment decisions and behavioral finance, practising trader since 2013, founder of arapov.trade, author of a trading book series (ORCID: 0009-0003-0430-778X).