Every Japanese candle carries four prices for its period: the open, the close, the high and the low. From the body and the wicks you read the fight between buyers and sellers over that stretch. But a pretty candle on its own means very little, and it comes alive only at a strong level with volume behind it.
Almost every beginner walks into trading through candles, and I was no exception. At first it looks like a ready-made map: spot a clean candle, jump in, collect. In practice the bare picture fools you more often than it helps. I lean on candlestick patterns every single day, the hammer and engulfing are working signals for me, but never by themselves. Below we go in order: how a candle is built, how to read direction from it, which patterns are genuinely worth knowing, and why they lie without a level and volume.
In this article we'll cover:
- a candle holds four prices, the body and wicks read as a fight between the two sides, and the close matters most;
- the patterns worth knowing are few: the pin bar, engulfing, the hammer, the doji and the evening star;
- a bare pattern, in my experience, sits close to a coin toss, with a hit rate near fifty-fifty;
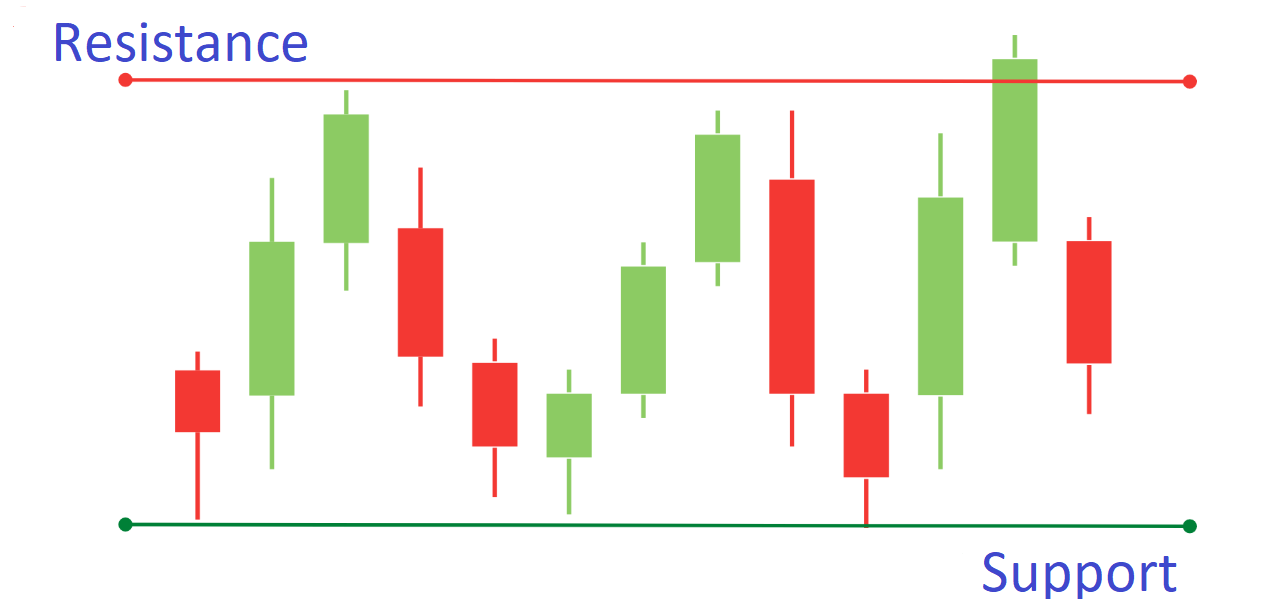
- what turns a pattern into a signal is a strong level and confirmation from volume, not its name.
We'll start with how the candle itself is put together.
What are Japanese candlesticks and how do you read them?
Japanese candlesticks are a type of exchange chart where each element holds four prices for the chosen period: the open, the close, the high and the low. A candle has a body and wicks, also called shadows or tails: the body is the span between the open and the close, while the wicks show how high and how low price wandered inside the period without holding there.
In effect, a single candle is the compressed story of one fight. A large body says the move was strong and that one side clearly ran the show, while long wicks reveal that price was shoved one way and beaten back, a rejection of those levels. The method is not new: a Japanese rice merchant, Munehisa Homma, devised it back in the eighteenth century, and the analyst Steve Nison later carried candles to the West. Homma grasped the key thing, that price is driven not only by the harvest but by the psychology of the crowd, and across three hundred years the tool has not changed, because its essence has not: the fear and greed of real people get stamped onto the chart. And the most important of the four prices is the close, because it shows who stayed in charge by the end of the period. That is why I always judge a candle by where it closed, not by where it managed to poke a wick.
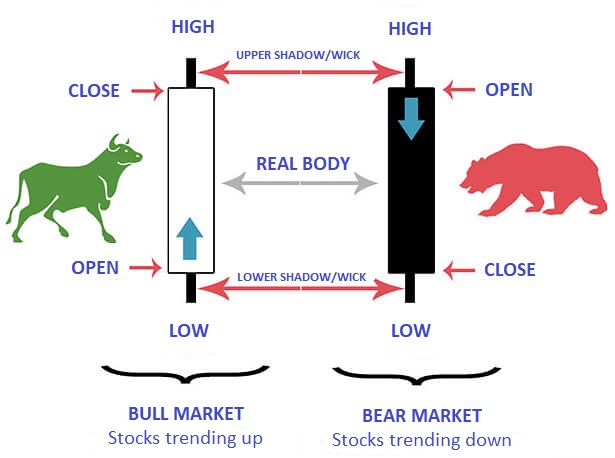
In short: A candle holds four prices for its period; a large body means one side dominated, long wicks mean levels were refused, and the close matters most because it shows who stayed in charge.
Bullish vs bearish candles: what the close really tells you
Nothing could be simpler here. If a candle closes higher than it opened, it is bullish, and buyers took that period. If it closes below its open, it is bearish, and sellers held the reins. On most platforms a bullish candle is green and a bearish one is red, but the colour is secondary; what counts is the pairing of open and close. The size of the body hints at strength: the larger it is relative to the wicks, the more confidently the winning side moved.
This is where the logic of volume analysis comes in. A large body on its own is not the whole story, it has to be backed by force, which is volume. A strong candle on high volume is genuine effort from big money, whereas the same candle on thin volume is, more often than not, a dud. That is exactly the effort versus result principle: you look not only at the candle but at what props it up. A long upper wick gives away weak buyers, a long lower one weak sellers, and those hints are far more honest than the colour of the body.
In short: Close above the open is bullish, below is bearish, colour is secondary; but a large body on weak volume is a hollow shell, only volume gives a candle real force.
The pin bar: a candle that rejects a level
A pin bar is a candle with a long wick and a small body that signals the rejection of a price level and a possible reversal. The name comes from the Pinocchio bar, the liar's nose: the long wick is the false move that the market instantly disowned. The wick should clearly overshoot the body, by two or three times, while the opposite wick is short or absent.
The mechanics are simple and honest. During the candle one side aggressively drives price its way and paints a long wick, but by the close the other side seizes the initiative and drags price back to the body. That is the rejection: there was an attempt, but no result, the same effort-without-result logic you see in a false break. You tell them apart by which side the wick sticks out from. A bullish pin bar shows up at the bottom after a decline, with a long lower wick: sellers pushed price down, buyers bought all of it back and lifted it, so sellers ran out of steam. The bearish one mirrors it, appearing at a top after a rise, where the long upper wick reports a failed attempt by buyers to settle higher. But here is what often goes unsaid: a pin bar is not a command to buy on its own, only a hint that one side is weak, and that hint has to be confirmed by a meaningful level and volume. A pin bar at strong support is worth your attention, the same one in the middle of the chart is close to useless.
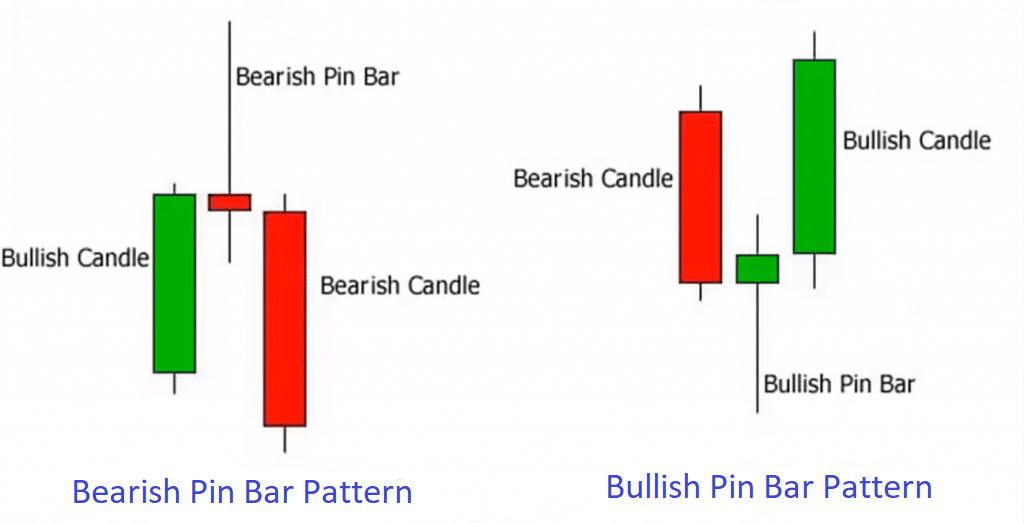
In short: A pin bar is a long wick with a small body, the trace of a level being rejected: the wick runs two to three times the body, a bullish one with a lower wick exposes weak sellers, a bearish one weak buyers, but it works only at a level.
Bullish and bearish engulfing: when control flips
Engulfing is a candlestick pattern of two neighbouring bars where the body of the second fully covers the body of the first and closes in the opposite direction. There are only two kinds. In bullish engulfing a small bearish bar comes first, then a bullish one that closes above the first body, a hint of a turn upward. The bearish version mirrors it: first a bullish bar, then a full-blooded bearish one that closes below its body.
In essence engulfing shows the moment one side overrode the effort of the other, which is close to that same effort-and-result principle. An important detail on the bar itself: the bigger the body of the engulfing candle and the smaller its opposite wicks, the stronger the side's advantage. A small body that barely covers the first bar is weak engulfing, which I do not trust even at a level. And the main thing, bullish engulfing makes sense not just anywhere but at a support level that price has come down into. The logic runs like this: price has failed several times to drop below one level, so there is a shortage of supply underneath, sellers are running out, and engulfing here is the point, visible on the candles, where demand overrode supply. Let me show it from my own screen. On euro futures I had marked out a range, and at its lower border price touched one level three times, and each time bullish engulfing appeared there and gave a clean bounce. In the middle of the range the very same pattern is just noise.
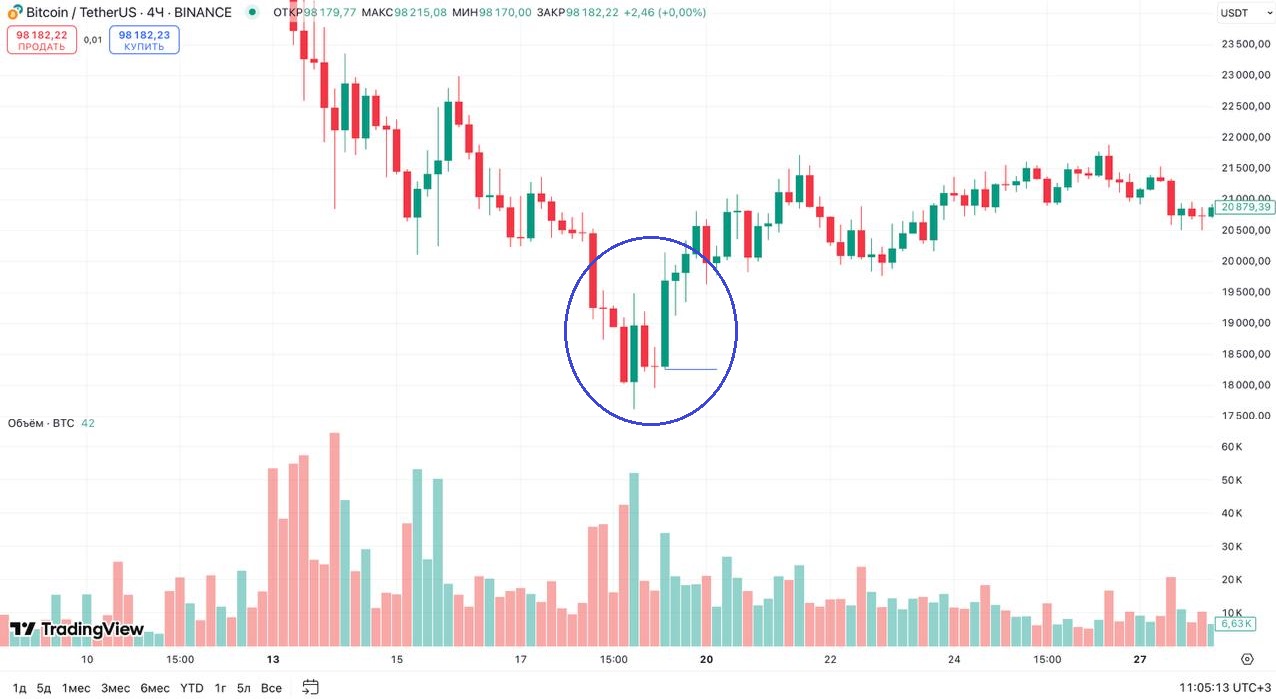
In short: Engulfing is two bars where the second covers the first body and closes back the other way; a large body is strong, a small one weak, and it only means something at a level, like euro futures with three touches and three bounces.
Harami is a small candle whose body sits entirely inside the body of the larger candle before it; the shape mirrors an engulfing, where instead the bigger bar swallows its neighbor. Its message is narrow: momentum has run out of breath and neither side holds the price yet. At a level that usually marks a pause and a squeeze in range rather than a turn, because a large player is filling a position inside the tight swing and is not moving price on purpose. So I never treat the candle itself as an entry. I wait to see which way the mother candle's boundary gives, and I take the move only when volume rises on the break; a break on hollow volume that slips straight back into the body reads to me as a liquidity grab, not the start of a trend. The special case of a harami in a contracting range is called an inside bar, and it runs on the same logic: the value is not in the candle but in how volume reacts to a break of its edges.
Hammer, doji and the evening star: the reversal candles
A hammer is a reversal candle with a small body at the top and a long lower wick that appears after a decline and hints at a turn upward: sellers drove price down, buyers brought it back. It is really the same thing as a pin bar, and it is often called exactly that. Its mirror image, the hanging man, looks the same but pops up at the peak of an advance and warns of a turn down.
A doji is built differently: it is a candle whose open and close almost coincide, so the body shrinks to a thin line. A doji shows balance and hesitation: neither buyers nor sellers took the upper hand, the market froze in thought. On its own it says nothing about direction, it is only a signal of a pause. The evening star is already a three-candle model at the top of a rise: a strong rising candle, then a small candle of hesitation, then a strong falling one. Together they paint a picture where the advance has run out of breath and sellers have grabbed the initiative, and the stronger that third, falling candle, the more convincing the signal. But the caveat is the same for all three: a hammer at a support level that price has already touched and bounced from more than once is a signal, while a hammer in the middle of the chart, in empty space, is just noise you should not even react to. Where to mark such levels correctly is laid out in the course section on working with levels, and how they tie into a false break I show in the material on level breakouts.
The evening star has a mirror twin on an upward turn, the morning star. It is also three candles at a bottom: a large bearish one, then a small hesitant candle gapped down, and after it a strong bullish candle that closes high in the body of the first. The meaning is the same as at the top, only reversed: the sellers are spent and buyers have seized the initiative. The shooting star belongs here too, a single candle with a long upper wick at a peak, the same rejection of height as a pin bar. But I repeat my rule for all candles: neither the morning star nor the shooting star is a signal on its own, I look at them only at a meaningful level and with confirmation by volume.
In short: A hammer is a long lower wick and a hint of a turn up, a doji is hesitation and a pause, the evening star is three candles at a top and a hint down, but all of them are a signal only at a strong level, and in empty space they are noise.
Do candlestick patterns actually work? Only at a level, with volume
Now the part that usually stays quiet. Any one of these candles, taken bare, sits close to a coin toss, with the odds split roughly evenly. The popularity of candlestick patterns is not the same as their reliability, and traders often fall for a single picture. Large quantitative backtests land in the same place: across big samples most named patterns barely beat chance, even the favourites like bullish engulfing or the morning star tend to show only a modest edge, and only once you add a trend filter, support and resistance, and volume does anything useful appear. So memorising dozens of exotic formations is pointless, a few base ones are enough, the pin bar, engulfing, the hammer, plus the understanding that they work only in tandem with a level and volume. Unlike candle signals on one or two bars, larger chart patterns of technical analysis are built from dozens of candles, but in my experience both kinds read only with volume and a level, otherwise it is just a picture.
I treat a candle as a hint about the market's intent, not as a command to enter. The command comes from the level, and the candle only fine-tunes the moment. The same hammer in an empty field and that hammer at proven support are two events with different meaning, so a hammer in bare space I skip, and a hammer at a key level with volume I take. Volume here is not decoration: a reversal candle at a level should come with raised volume, which shows that big capital arrived at that point, and that is a direct illustration of the effort-and-result principle. Even a modest hit rate, under that filter and with a good reward-to-risk ratio, comes out ahead over the long run. This is not a recommendation to you, it is my working principle: a candle is not a signal in itself, only the final brushstroke on a picture already in place, and without a strong level beneath it even the prettiest candle is, for me, just market noise. What in candles is actually useful, and what is not worth your time, I show on the chart in this video: reading Japanese candles on a live chart.
In short: A bare candle is a coin toss split roughly evenly, the command comes from the level and the candle only fine-tunes the moment; a hammer in empty space I skip, at proven support with volume I take, because a candle is the final brushstroke, not a signal on its own.
In this article I show how candlestick analysis fits into the wider job of reading a chart.
Frequently asked questions
It is a chart where every candle carries four prices for its period: the open, the close, the high and the low. The body and the wicks show how buyers and sellers fought over that stretch. The most important of the four is the close, because it shows who stayed in charge by the end.
A handful is enough: the pin bar, engulfing and the hammer. On their own their odds sit close to a coin toss, and large backtests confirm it. They turn into a working signal only at a strong level and with confirmation from volume. Memorising dozens of exotic formations is wasted effort.
A pin bar is one candle with a long wick and a small body, the trace of a level being rejected. Engulfing is two candles, where the second fully covers the body of the first and closes the other way, the moment control changes hands. Both matter only at a meaningful level.
A doji is a candle whose open and close almost coincide, so the body shrinks to a thin line. It shows balance and hesitation: neither buyers nor sellers took the upper hand. On its own a doji says nothing about direction, it is only a signal of a pause.
In my experience, no. A candle by itself is a picture with the odds split roughly evenly. I use it as the final brushstroke on a picture that is already there, only next to a key level and with confirmation from volume. The level gives the command to enter, the candle only fine-tunes the moment.
About the Author
Author: Igor Arapov — independent researcher in the psychology of investment decisions and behavioral finance, practising trader since 2013, founder of arapov.trade, author of a trading book series (ORCID: 0009-0003-0430-778X).