Behind every fair value gap sits a plain mechanic: on one side of the market the orders ran out, the big buyer had no one left to buy from, and price had to jump higher to find the rest. That jump leaves a hole on the chart, and the market, leaning toward balance, often drifts back to fill it. That is the whole story, dressed up in fashionable words.
The words carry a Smart Money shine, yet the thing underneath them is old and simple. When large capital pushes price fast, the market skips levels without trading them properly, and a tail is left behind for price to revisit. To me this is repackaged volume analysis, so I look at these zones without any awe: let us go through what they are, how to spot them by three candles, how the entry on the retrace is built, why an imbalance is sturdier paired with an order block, and where the real trap is buried.
In this article we'll cover:
- an imbalance is the mark of a fast move, where supply and demand stayed out of balance;
- a fair value gap is a three-candle window you can see on any chart;
- the market leans toward balance, so price comes back to the zone, but not always;
- the zone fires hardest when the imbalance lands on an order block and volume confirms it.
Let's start with what actually hides behind these two words.
What a fair value gap and an imbalance actually are
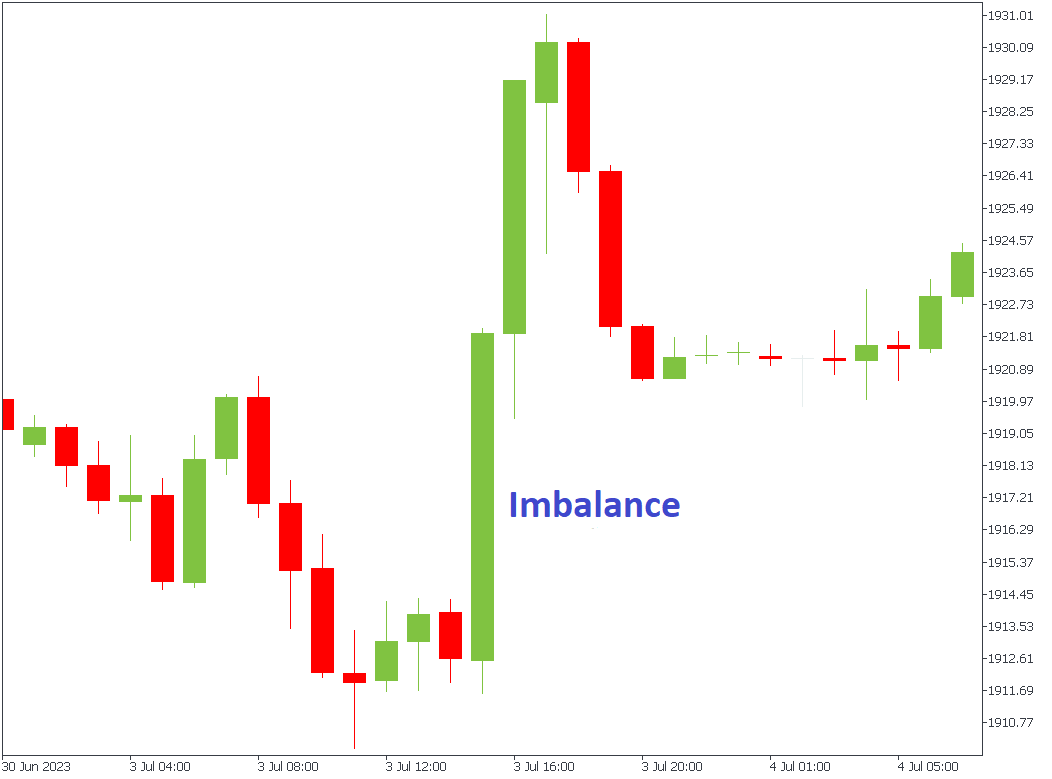
An Imbalance is a skew between supply and demand where price runs through a patch of the chart so fast that part of the orders in that zone never get filled.
A Fair Value Gap is the most recognisable form of an imbalance: a visible three-candle gap that price covered in one sharp move. Worth keeping straight here: every FVG is an imbalance, yet not every imbalance is drawn as a textbook FVG. The term itself was popularised by Michael Huddleston, the trader known as ICT, but the behaviour behind it long predates the label.
The mechanic of the gap is easy. At some point one side of the market simply runs dry. If a large buyer down low has no one left to buy from, the counterparty is gone, and to grab the rest of that scarce liquidity the buyer has to offer a higher price. Price flies up in a burst and leaves an imbalance behind. The market spends most of its life parked in a dull balance, in a flat, then it suddenly breaks one way, and the imbalance is exactly that moment of the break, which is why the idea works on any instrument, from currencies and futures to crypto. A sharp move almost always tosses unfilled orders behind it, and since the market reaches for equilibrium, price dips back to the zone, picks up the liquidity it left, and only then carries on. In plain terms this is precisely what volume analysis has long called a zone of aggressive entry by large capital, just re-stamped with the trendy terms of Smart Money.
In short: An imbalance is a supply-demand skew after a sharp move, and an FVG is its visible three-candle gap; a volume deficit on one side sits behind every gap, and because the market reaches for balance, price comes back to the zone.
How to spot an FVG on a chart: the three-candle rule
Three candles is all the search takes, and the middle one does the work. You line up three neighbours and look at that middle candle, the one that drove the strong move. For a bullish gap the low of the third candle should sit above the high of the first: the space between them is a stretch price flew through without proper trading, and that is the fair value gap. For a bearish gap it is mirrored, the high of the third candle below the low of the first. A bullish gap then works as support, a bearish one as resistance.
The strict three candles are not dogma. What matters is not the candle count but the patch of impulse that never got traded through, and on higher timeframes like the hour and four-hour these zones read cleaner. Only not every window is worth the same. The ones I rate are born on elevated volume and near key levels, where a flat and some accumulation came before the burst. Without reading volume, an FVG slides easily into plain guesswork.
Most gaps on a chart are noise. An FVG becomes tradeable not in a vacuum but inside an impulse phase of the market, after liquidity has been taken, and in the direction of the higher structure. A lone gap in the middle of a sluggish move, with no tie to a level or to volume, I skip more often than not: it lacks the support the zone is drawn for in the first place, so it earns less trust.
In short: Spot an FVG by three candles: for a bullish one the third low sits above the first high, for a bearish one it is mirrored; take only gaps on elevated volume near key levels into work.
How to trade a fair value gap: wait for the retrace
Let price come back to the imbalance zone and join the main move, that is the whole plan and the rest is patience. After the impulse price pulls back, reaches the FVG, and there it meets the resting interest of the very large capital that started the move. A bullish gap is traded long, a bearish one short, the stop is hidden behind the far edge of the gap, and the target is set on the next level. I keep risk to reward from 1 to 2, ideally from 1 to 3, so a string of entries stays in profit even with mistakes.
But there is one caveat, and without it this turns into guesswork. Price returns to the zone often, yet not always: on higher timeframes and on news a gap can stay open for a long time, sometimes forever. So charging into the zone blind is dangerous. It is calmer to wait for a signal: how price reacts on the return, whether a pin bar or a clear rejection shows up, and what volume says at that second. When volume dries up on the approach into the zone and a reaction in the right direction then sprouts, the zone is alive. The same liquidity-deficit mechanic drives working with levels: price is dragged past a level, the opposing orders are taken, and the move reverses. How I read reversal points through disbalance on a live chart I show in the video on market disbalance and reversal points.
In short: Wait for the pull-back to the zone and enter along the impulse, but only on a reaction and drying volume at risk to reward from 1 to 2; price does not always return, so you never enter blind, and the stop goes behind the far edge.
Fair value gap vs order block
A gap by itself is a weak signal, and it earns its keep only when it overlaps an order block. An order block is the patch the impulse started from, the point where large capital was building a position, while the imbalance is already the trail of that impulse. It makes sense that they often stand side by side: first the build-up, then the burst. Let price come back to where the order block and the fair value gap met, and on top of that under volume confirmation, and the odds of a clean reaction step up noticeably. Think of the gap as the footprint left after the order block fired.
And why a strong move gives away a large player at all is explained by the effort versus result principle: heavy effort on volume leaves a visible mark, and that mark is exactly what we read on the gap. Without volume any imbalance and order block stay bare rectangles on the screen: they hint at where to look, but they promise no outcome. The last word always belongs to confirmation of real large interest.
In short: Imbalance plus order block plus volume is a strong zone: first the build-up in the order block, then the burst and its trail; alone and without volume these are just rectangles that promise nothing.
Which gaps are real: why every imbalance is a volume deficit
A gap on my chart is a place to look and nothing more, the same plain status I give an order block. Behind every imbalance, in my experience, there is always one cause: one side of the market ran out of volume, the large player has no one left to buy from, and out of necessity it gives a higher price, leaving a gap. To me this is no chart magic but ordinary liquidity deficit, and that is why I hunt these zones through volume and structure: first I find the balance, the flat and a cluster of volume in the range, then I catch the moment it breaks into disbalance. A balance before the break is usually a phase of accumulation by large capital, so the most honest imbalances I look for not just anywhere but at value levels.
And no illusions, this is not advice to you personally but how I act myself: an FVG is not a holy grail, you will be wrong either way. Walking into a zone at random, with no confirmation at all, is my most frequent miss on FVG. I wait to see how price answers the return and what volume says, and only then do I enter, working on the principle of see first, then join. The strength of a zone is not in its shape but in the large interest that volume either confirms or does not.
In short: An imbalance and an FVG are repackaged volume analysis: the zone only points to a place, while the call to enter comes from large interest confirmed by volume, and the honest gaps I look for at value levels, never entering blind.
An imbalance and an FVG are only a slice of the larger logic of big capital, so the next sensible step is to gather the whole picture in the full Smart Money guide.
Frequently Asked Questions
A fair value gap is a zone the price ran through too fast, leaving supply and demand out of balance. On the chart it shows up as a visible gap across three candles, where one side simply ran out of orders and price had to jump to find the rest.
Not exactly. An imbalance is the pressure itself, one side of the market pushing harder than the other. A fair value gap is the most recognisable way that pressure shows up on the chart, a three-candle gap. So every FVG is an imbalance, but not every imbalance is drawn as a textbook FVG.
No. Price often returns to a gap because the market leans toward balance and wants the orders left behind, but it is not a rule. On higher timeframes and after news a gap can stay open for a long time, sometimes for good. Trading every gap as a guaranteed fill is how accounts bleed out.
An order block is the spot where the impulse started, where large capital was building a position. A fair value gap is the trail left by that same impulse. They work best as a pair, and only when volume confirms the interest behind them.
You wait for price to come back to the zone, then enter in the direction of the main move, but only after the chart reacts, a pin bar or a clear rejection, and only on drying volume. Stop goes beyond the far edge of the gap, target on the next level.
Higher timeframes read cleaner. The hour and four-hour show meaningful imbalances, while a lower frame like the 15-minute helps time the entry inside the zone. Small gaps on a noisy lower frame are mostly chart litter.
About the Author
Author: Igor Arapov — independent researcher in the psychology of investment decisions and behavioral finance, practising trader since 2013, founder of arapov.trade, author of a trading book series (ORCID: 0009-0003-0430-778X).