ATR Indicator: Complete Guide to Measuring Market Volatility
Understanding Volatility and the Role of ATR
Financial markets constantly alternate between periods of activity and calm. Understanding current market dynamics determines strategy selection and risk management parameters. ATR (Average True Range) represents a technical indicator developed by Welles Wilder for objectively measuring market volatility regardless of price direction. To understand this topic more deeply, I recommend studying technical indicators.
The indicator reflects average price swing amplitude over a defined time interval. High values indicate active markets with wide movements, low values suggest consolidation and narrowing trading ranges. Traders use this information to adapt trading systems to changing conditions and place protective orders at optimal distances from entry points.
The fundamental characteristic of ATR lies in its neutrality regarding trend direction. The indicator responds equally to upward and downward movements, measuring exclusively oscillation amplitude. This makes it a universal risk management tool applicable in any market conditions across all financial instruments from currency pairs to cryptocurrencies.
The indicator's history dates back to the nineteen seventies. Welles Wilder introduced ATR in his book on technical trading systems alongside other well-known indicators: RSI, Parabolic SAR, and ADX. Since then, Average True Range has become firmly established in professional traders' arsenals as a reliable market activity assessment tool.
Mathematical Foundation of Indicator Calculation
ATR calculation is based on the True Range concept, which considers not only intraday price spread but also potential gaps relative to previous closing. For each period, the maximum value is determined from three figures: difference between current high and low, absolute deviation of high from previous close, and absolute deviation of low from previous close.
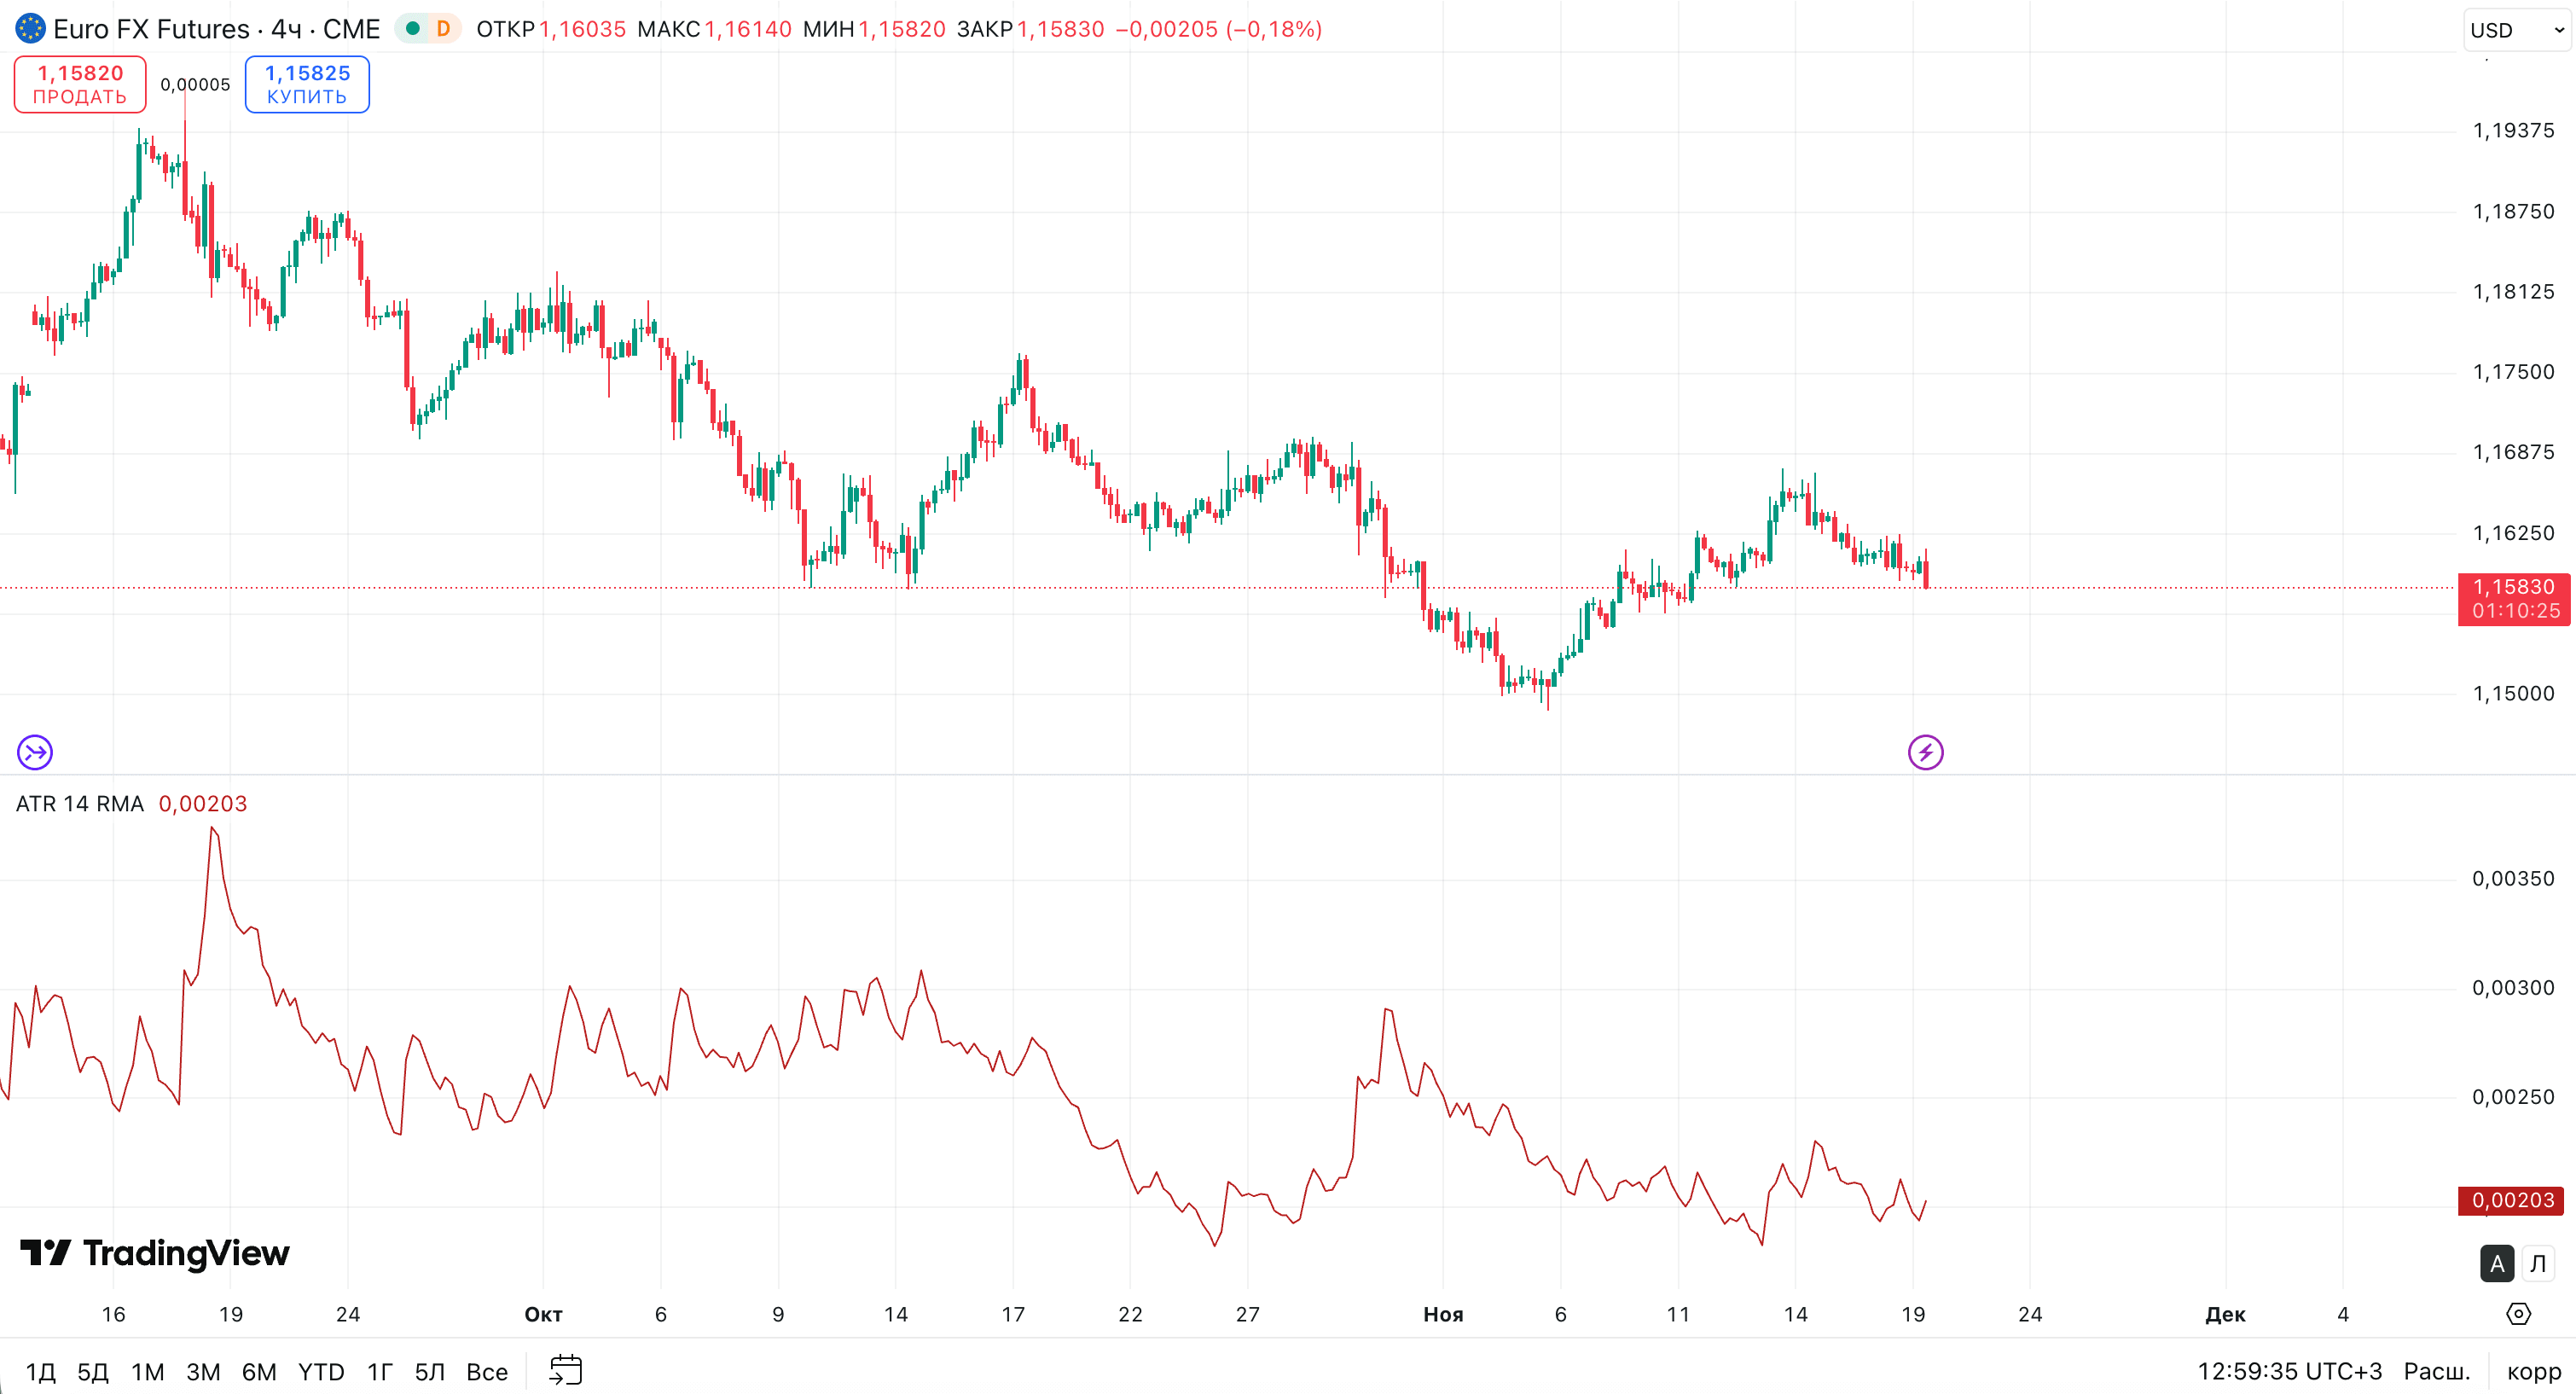
Obtained true range values are averaged using exponential smoothing over the selected period. Standard settings use fourteen candles, providing balance between sensitivity and smoothness of readings. Modern trading platforms perform all calculations automatically, displaying results as a continuous line below the main price chart.
Period selection significantly affects indicator behavior. Shortening the period increases sensitivity to short-term volatility changes, suitable for scalping and intraday trading. Increasing the period creates a smoother line with delayed reaction, preferable for positional strategies and medium-term investing.
The true range formula accounts for gaps between previous candle close and current candle open. Such gaps are especially characteristic of stock markets after weekends or major news releases. Classical high-minus-low calculation would miss this information, understating actual volatility.
Interpreting ATR Readings
The indicator's absolute value reflects average price movement range in instrument measurement units. For currency pairs, results are expressed in pips, for stocks and indices in monetary units or percentages. Comparing current values with historical levels allows assessment of relative volatility and market cycle phase determination.
Rising ATR signals increasing participant activity and trading range expansion. Such periods are characterized by impulsive movements, level breakouts, and new trend formation. Traders widen protective orders and increase profit targets, adapting to enhanced market dynamics.
Declining ATR indicates volatility compression and market transition to consolidation phase. Price fluctuations occur in narrowing ranges, building potential for subsequent breakouts. Experienced traders prepare for range exits by placing pending orders beyond consolidation boundaries.
Extremely high ATR values often coincide with trend movement climax and precede reversals or deep corrections. Sharp volatility spikes during prolonged trends warn of possible driving force exhaustion and market phase changes. Attentive traders lock profits or tighten protective orders.
Seasonal and temporal patterns influence indicator readings. Volatility typically increases at trading session beginnings and during European-American session overlaps in forex markets. Holiday periods and summer months are characterized by reduced activity and corresponding ATR value drops.
Setting Protective Orders Based on ATR
The most common indicator application involves determining optimal stop-loss distance. The classic approach places protective orders at one to three ATR values from entry point. This methodology accounts for actual price oscillation amplitude and minimizes probability of premature triggering from random market noise.
Specific multiplier selection depends on trading style and risk tolerance. Conservative traders prefer coefficients of one-point-five to two, providing comfortable allowance for natural price fluctuations. Aggressive strategies permit using one ATR, increasing potential reward-to-risk ratio at the cost of more frequent stop-outs.
Dynamic position management is implemented through ATR-based trailing stops. Protective orders automatically follow price while maintaining fixed distance in volatility units. The method captures significant portions of trend movements while protecting accumulated profits from sharp reversals.
Alternative approaches combine ATR with technical support and resistance levels. Calculated distance serves as reference, while final stop placement adjusts relative to nearest significant price zones. This hybrid methodology enhances protection stability through structural barrier utilization.
Position sizing calculation organically connects with ATR-based stops. Knowing protective order distance in pips and acceptable risk percentage of deposit, traders determine optimal trade volume. This approach ensures consistent capital management regardless of specific instrument volatility.
Trading Strategies Using ATR
The indicator effectively complements various trading systems, improving signal quality and optimizing position management. ATR integration into existing methodology requires no radical changes; simply add volatility filtering and adaptive risk parameters.
Volatility breakout strategy uses low ATR values as harbingers of upcoming impulses. Indicator compression below historical minimums signals energy accumulation before sharp movement. Traders place pending orders beyond current range boundaries anticipating directional breakouts.
Counter-trend trading relies on extreme ATR values as market overheating indicators. Price traveling seventy to eighty percent of average daily range increases pullback or reversal probability. Positions open against current impulse with tight stops and conservative profit targets.
Filtering other indicators' signals through ATR eliminates weak entries during low activity periods. RSI, MACD, or moving average crossover signals are accepted only at sufficient volatility levels guaranteeing movement potential for reaching profit targets.
Adapting profit targets to current volatility increases trading expectation realism. Take-profit is set as ATR multiples, ensuring target proportionality to market conditions. During high volatility, targets expand; during low volatility, they contract proportionally to indicator readings.
Application Specifics Across Different Markets
ATR universality allows indicator use on any financial instruments with minor parameter adaptations. Forex markets are characterized by relatively stable volatility with pronounced session fluctuations. Optimal calculation period is fourteen to twenty candles for daily timeframes.
Stock markets demonstrate significant volatility differences between individual equities. Liquid blue chips show moderate ATR values, while growth stocks and small caps feature elevated variability. Individual stop-loss multiplier calibration accounts for specific issuer characteristics.
Cryptocurrency markets are characterized by extreme volatility significantly exceeding traditional assets. ATR values are an order of magnitude higher than comparable currency pair readings, requiring corresponding protective distance increases. Calculation period shortens to seven to ten candles for more responsive adaptation.
Commodities and futures contracts have their own volatility patterns. Oil and gold react to geopolitical events with sharp ATR spikes. Agricultural commodities show seasonal volatility fluctuations depending on weather conditions and harvest periods.
Combining with Other Analysis Tools
Maximum ATR effectiveness is achieved within comprehensive trading systems combining multiple complementary indicators. Trend tools determine movement direction, oscillators identify overbought and oversold conditions, while ATR ensures risk parameter adaptation to current conditions.
Combination with Bollinger Bands creates multi-level volatility assessment systems. Band expansion coincides with ATR growth, confirming increased market activity. Simultaneous narrowing of both indicators forms strong signals of impending impulses from consolidation.
Integration with volume analysis increases volatility signal reliability. ATR growth against increasing trading volumes indicates large player participation and raises movement continuation probability. Divergence between volatility and activity warns of potential current impulse falseness.
Common Mistakes When Using ATR
Beginners often perceive ATR as a signal indicator, expecting entry directions from it. Such application contradicts the instrument's nature, designed exclusively for volatility measurement and risk management. Trading decisions are based on other analytical methods. To consolidate this material, also study Bollinger Bands.
Ignoring market context when interpreting values leads to erroneous conclusions. Absolute ATR numbers are informative only when compared with historical levels of specific instruments. A high value for one asset may prove average for another with different volatility profiles.
Mechanical application of fixed multipliers without considering market conditions reduces protective order effectiveness. Optimal coefficients vary depending on timeframe, trading style, and current market phase. Regular parameter reassessment enhances risk management system adaptability.
Frequently Asked Questions
ATR shows average price movement range over selected period, measuring market volatility without indicating trend direction.
Stop-loss is placed one to three ATR from entry point. Conservative approach uses multiplier of one-point-five to two, aggressive allows one ATR.
Standard period is fourteen candles. For short-term trading use seven to ten, for long-term twenty to fifty.
High ATR indicates increased volatility with strong movements. Low ATR signals consolidation and sideways movement often preceding breakouts.
ATR does not generate entry signals directly. It serves as volatility measurement and risk management tool alongside other indicators.
About the Author
Author: Igor Arapov — independent researcher in trading psychology and behavioral finance, practising trader since 2013, founder of arapov.trade, author of a trading book series (Open Library ), (ORCID: 0009-0003-0430-778X ).