Bitcoin Dominance (BTC.D): What It Is and How to Use It in Trading
The cryptocurrency market operates with unique metrics, and Bitcoin dominance stands as one of the most important indicators for understanding market sentiment. This metric answers a fundamental question for any crypto trader: where is capital flowing — into BTC or into alternative cryptocurrencies? Understanding dominance dynamics enables more informed portfolio allocation decisions.
BTC.D (Bitcoin Dominance) represents the percentage of Bitcoin's market capitalization relative to the total market capitalization of all cryptocurrencies combined. The calculation is straightforward: BTC market cap divided by total crypto market cap, multiplied by 100%. When this indicator rises, investors favor the reliability of the first cryptocurrency. When it falls, interest shifts toward altcoins.
In practice, Bitcoin dominance fluctuates within a wide range. During periods of market uncertainty, it can exceed 60%, while during altseason it drops to 40% or below. These fluctuations create opportunities for active traders monitoring capital flow between different crypto market segments. To understand this topic more deeply, I recommend studying crypto trading.
Historical Evolution: From Monopoly to Cycles
The history of BTC.D mirrors the evolution of the entire cryptocurrency industry. From 2009 to 2016, dominance remained at 90-99% — altcoins barely existed. Litecoin, launched in 2011, and a handful of other projects occupied less than 1% of the market. Bitcoin was synonymous with cryptocurrency as an asset class.
The first major shift occurred in 2017 with the launch of thousands of ICO projects built on Ethereum. Over 12 months, dominance plummeted from 87% to 37%. Altcoin capitalization surged from $5 billion to $500 billion. This marked the first genuine altseason, when certain tokens delivered gains measured in tens of thousands of percent.
The subsequent crypto winter of 2018-2019 drove capital back into Bitcoin. Approximately 90% of ICO projects failed, investors locked in losses and sought refuge in BTC. Dominance recovered to 70%. Notably, while Bitcoin dropped 85%, altcoins lost 95-99% of their value — BTC's relative resilience confirmed its status as the crypto world's "safe haven."
The 2020-2021 period brought the second altseason, fueled by the DeFi and NFT boom. Projects like Uniswap, Chainlink, and Solana attracted billions of dollars. Bitcoin dominance reached an all-time low of 38.7%. However, the 2022 collapses (Terra/LUNA, FTX, 3AC) once again redirected capital flows toward Bitcoin.
Reading the Dominance Chart
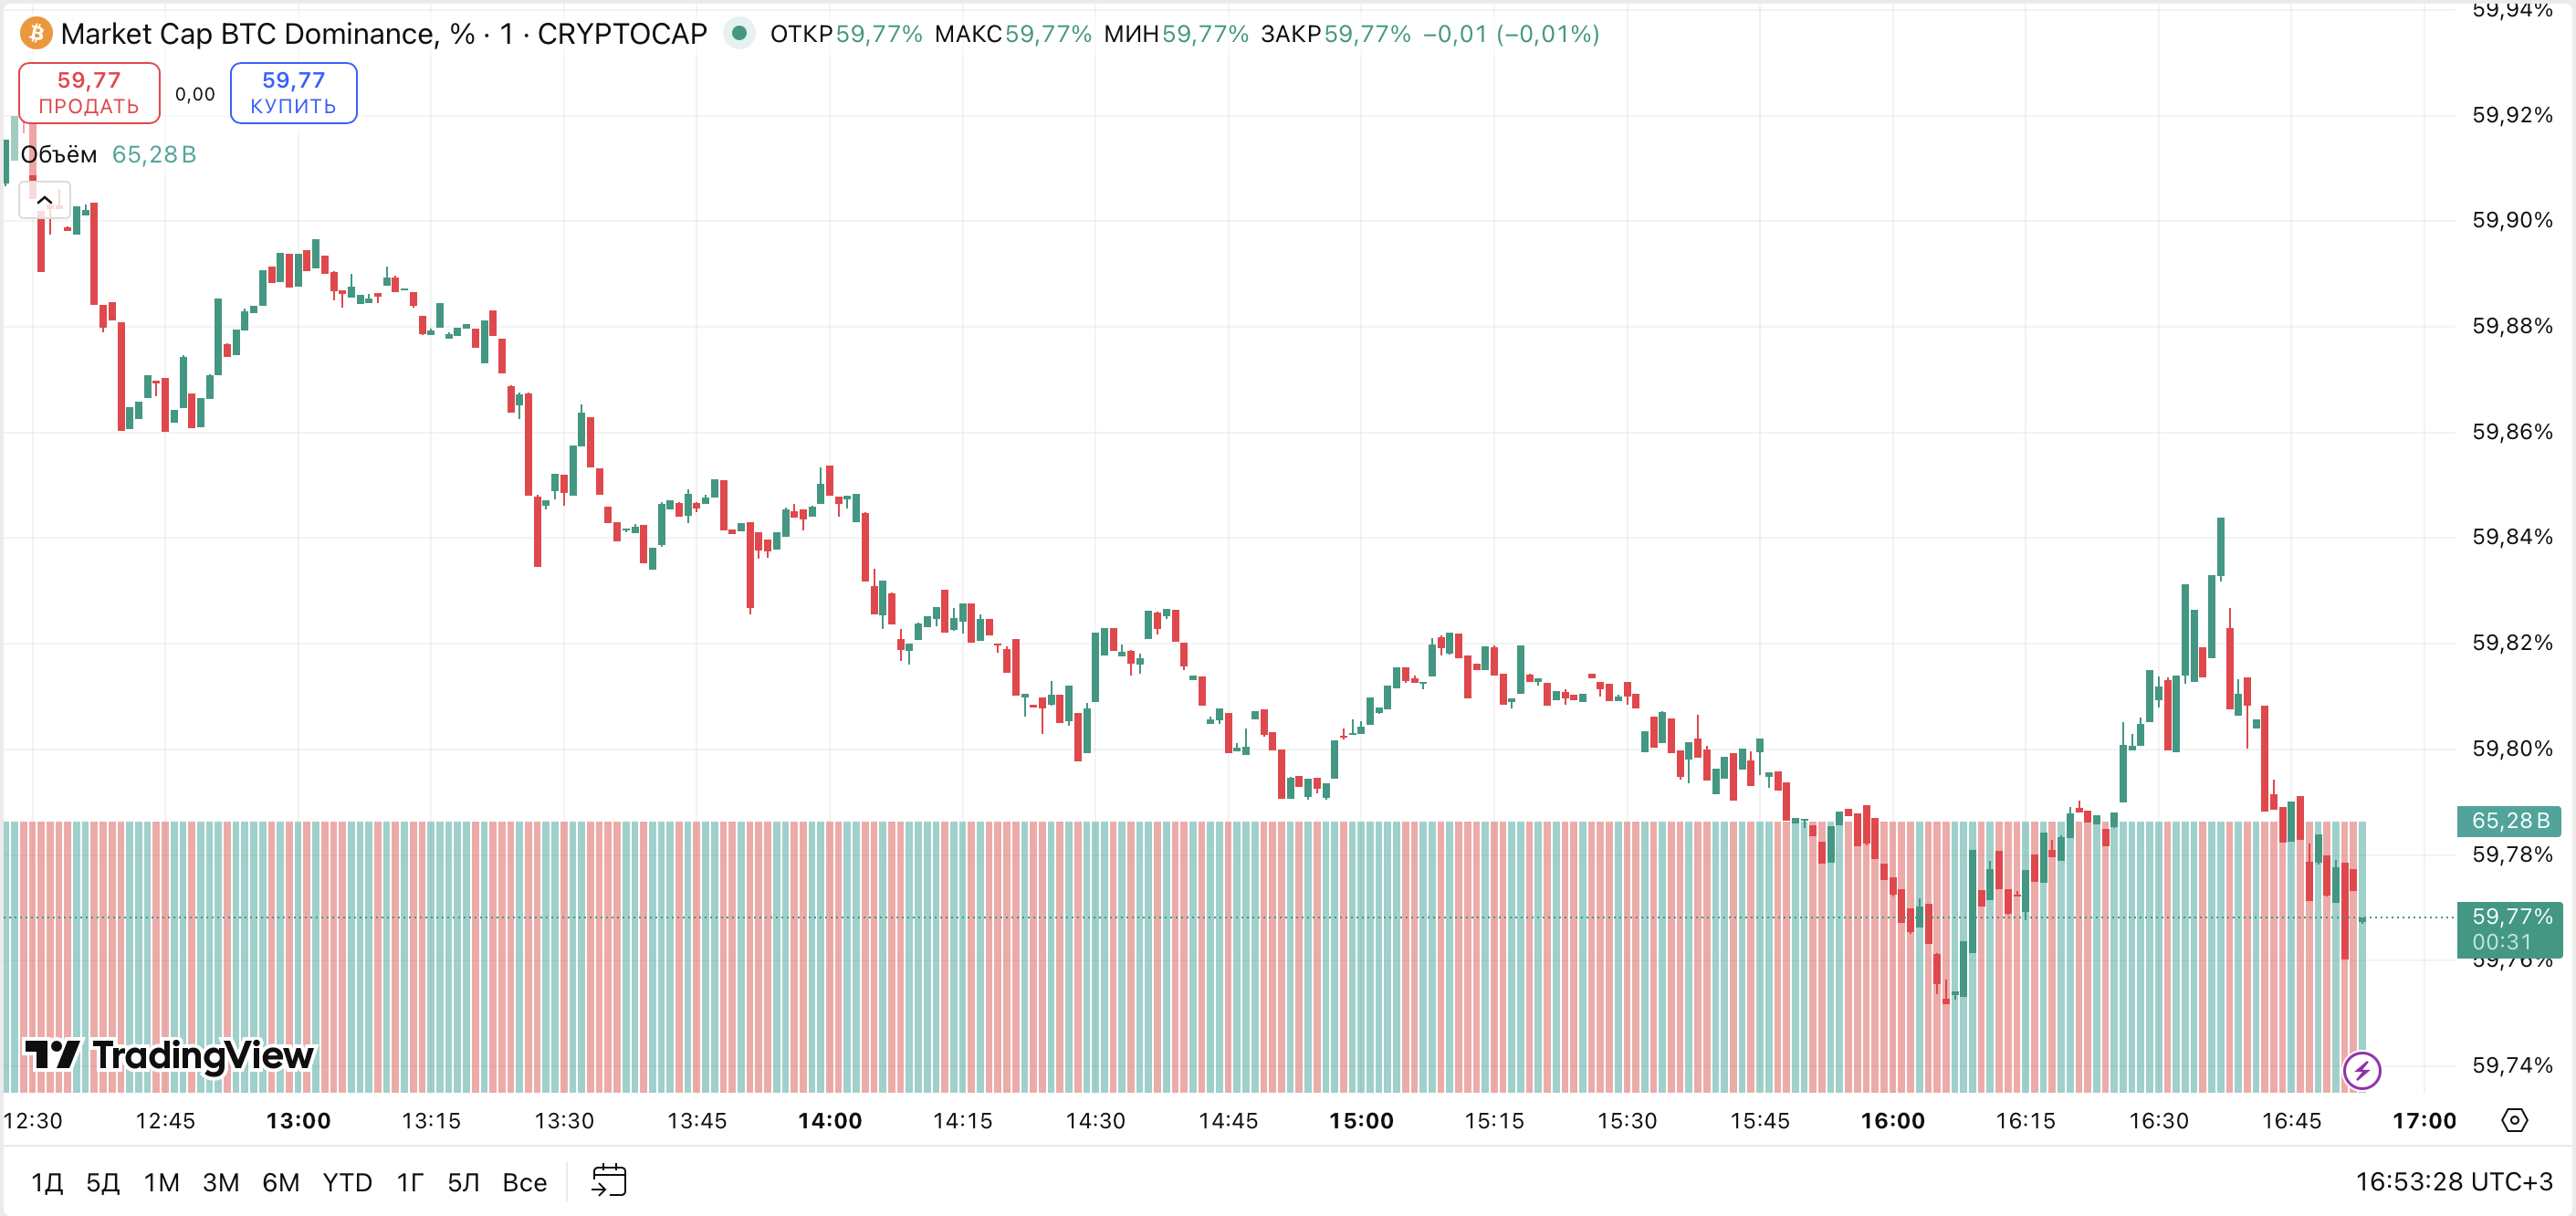
The BTC.D chart is available on multiple platforms, but TradingView remains the most functional tool. Enter ticker BTC.D to access an interactive chart with options for indicator overlay, level construction, and alert configuration.
Key levels traders monitor include: 40% (potential bottom zone), 45-48% (altseason initiation zone), 50% (psychological balance level), 55-58% (dominance growth zone), and 60%+ (strong BTC dominance). Breaks of these levels often accompany significant altcoin market movements.
For advanced crypto market analysis, traders use platforms like Glassnode and CryptoQuant. These provide data on large holder capital flows, exchange reserve changes, and realized capitalization. Such metrics reveal not only current dominance status but potential reversal points as well.
Correlating the BTC.D chart with Bitcoin's price chart proves essential. Rising BTC price with falling dominance represents a classic altseason signal: Bitcoin rises, but altcoins rise even faster. Falling price with rising dominance indicates capital flight from alts during broader market correction.
Impact on Altcoins
Bitcoin dominance and altcoin dynamics maintain an inverse relationship. When BTC.D rises, alternative cryptocurrencies lose liquidity, trading volume, and value. When dominance falls, capital inflows into alts begin, generating hype and explosive growth in individual tokens.
Historical examples confirm this pattern. In January 2018, with BTC.D around 37%, altcoins delivered extreme gains. In May 2021, at similar dominance levels, DOGE surged 20,000% while SHIB gained a million percent. Conversely, in November 2024 with dominance above 60%, approximately 70% of altcoins lost more than half their value.
The cycle mechanism operates as follows: investors take profits in Bitcoin, reallocate to altcoins, prices rise, attracting retail investors, FOMO develops, peaks form, profit-taking occurs, capital returns to BTC, and the cycle repeats. Understanding this dynamic enables traders to stay ahead of the crowd.
Practical Trading Signals
Traders employ specific dominance thresholds for decision-making. BTC.D below 48% traditionally signals green light for increasing altcoin positions. BTC.D above 58% serves as a red flag — capital flows into Bitcoin, and altcoin positions warrant reduction.
However, absolute values prove less informative than rate of change. A rapid 5-7% dominance drop over several weeks delivers a stronger altseason signal than merely residing below a certain level. Similarly, sharp BTC.D increases warn of potential altcoin corrections.
For signal confirmation, additional indicators are recommended: RSI on the BTC.D chart for identifying overbought/oversold conditions, moving averages for trend identification, plus total market capitalization (TOTAL) and altcoin capitalization (TOTAL2) for assessing new capital inflows.
Trading Strategies with BTC.D
Experienced traders have developed several approaches to utilizing Bitcoin dominance. The first strategy involves trend-following: during sustained BTC.D rises, increase Bitcoin portfolio allocation while reducing alts. During sustained drops, accumulate promising altcoins.
The second strategy employs contrarian trading at extremes. When dominance reaches historically high levels (above 60-65%), this may signal imminent reversal and altseason onset. Similarly, extremely low values (below 38-40%) often precede capital return to Bitcoin. This approach requires patience and willingness to act against prevailing market sentiment.
The third strategy focuses on sector rotation. Traders track not only overall BTC dominance but also Ethereum dominance (ETH.D) and top-10 coin dominance. This reveals whether capital flows into large altcoins or high-risk smaller tokens. Falling ETH.D with rising TOTAL2 indicates interest in altcoins beyond the top tier.
Indicator Limitations
Despite its utility, BTC.D has significant limitations. Stablecoins distort the metric: growing USDT and USDC capitalization reduces Bitcoin dominance even without actual altcoin capital inflow. Some analysts recommend using "pure" dominance excluding stablecoins.
Another limitation involves the large altcoin effect. Substantial Ethereum gains or losses significantly impact BTC.D regardless of broader market dynamics. Therefore, analyzing dominance in context of specific large coin movements is advisable.
Additionally, dominance functions as a lagging indicator. It reflects capital flows that have already occurred rather than predicting future movements. For forecasting, leading indicators work better: trading volumes, exchange inflows, social media activity, and on-chain metrics.
Factors Influencing Dominance
Multiple factors affect BTC.D dynamics. Institutional Bitcoin purchases through ETFs and large funds increase dominance. Successful altcoin project launches and emergence of new sectors (DeFi, NFT, GameFi, AI tokens) decrease it. Regulatory news affecting specific altcoins also triggers capital reallocation.
The macroeconomic environment plays a significant role. During periods of uncertainty and reduced risk appetite, investors prefer Bitcoin's relative stability. During optimistic periods and yield-seeking phases, capital flows into riskier altcoins with greater upside potential.
Conclusion
Bitcoin dominance represents a fundamental indicator of cryptocurrency market sentiment. It reflects the balance of power between Bitcoin and altcoins, showing capital flow direction and current market cycle phase. Rising BTC.D signals flight to quality; falling dominance indicates the start of alternative cryptocurrency season. To consolidate the material, also study halving of Bitcoin.
Effective use of this indicator requires combining absolute value analysis with change dynamics assessment, considering macroeconomic context, and applying additional technical tools. Understanding the cyclical nature of dominance enables traders to more accurately time portfolio rebalancing between Bitcoin and altcoins.
Remember that BTC.D is just one analytical tool and should be used alongside other methods. Successful cryptocurrency trading demands a comprehensive approach encompassing technical analysis, fundamental research, and proper risk management.
Frequently Asked Questions
Bitcoin dominance (BTC.D) is a percentage showing Bitcoin's share of the total cryptocurrency market capitalization. For example, 60% dominance means that of all money invested in cryptocurrencies, 60% is in Bitcoin while 40% is distributed among all other coins combined.
Falling Bitcoin dominance signals capital flowing from BTC into altcoins. This often occurs during 'altseason' periods when investors take profits in Bitcoin and allocate funds to alternative cryptocurrencies seeking higher returns.
Historically, altseason often begins when BTC.D falls below 45-48%. However, this isn't a strict rule — the overall dominance trend, trading volumes, and macroeconomic factors matter. A rapid BTC.D drop over a short period is a more reliable signal than the absolute value.
The BTC.D chart is available on TradingView (ticker BTC.D), CoinMarketCap and CoinGecko in the global charts section, as well as on analytical platforms Glassnode and CryptoQuant with advanced metrics. TradingView allows adding indicators and setting alerts.
Dominance rises when investors move funds from altcoins to Bitcoin. Reasons include: market uncertainty, major altcoin crashes, institutional BTC purchases, Bitcoin ETF launches, or negative news in the altcoin sector. BTC is perceived as the 'safe haven' of the crypto world.
About the Author
Author: Igor Arapov — independent researcher in trading psychology and behavioral finance, practising trader since 2013, founder of arapov.trade, author of a trading book series (Open Library ), (ORCID: 0009-0003-0430-778X ).