The S&P 500 stands as the world's most watched equity benchmark, representing the backbone of US corporate performance. For traders, the index offers exceptional liquidity, clear technical structure, and exposure to American economic dynamism. Understanding its composition, drivers, and trading mechanics enables effective participation in global equity markets.
Comprising 500 leading companies across all major sectors, the index captures approximately 80% of available US market capitalization. This broad representation makes it the definitive gauge of American stock market health. Institutional investors benchmark performance against the S&P 500, ensuring continuous participation and reliable price discovery. To understand this topic more deeply, I recommend reading light stock indices .
Index Composition
Technology sector dominates current index weighting, with companies like Apple, Microsoft, and Nvidia representing substantial portions. This concentration means technology movements disproportionately affect index performance. Understanding sector weights helps anticipate index reactions to sector-specific news.
Market cap weighting means larger companies have greater influence. The top 10 holdings often represent 25-30% of total index value. Mega-cap earnings and price movements carry outsized importance for index direction.
Quarterly rebalancing adjusts component weights based on market cap changes. Index additions and deletions generate trading activity as funds tracking the index adjust positions. These mechanical flows create predictable price patterns around announcement and effective dates.
Fundamental Drivers
FOMC decisions dominate index direction through interest rate effects. Lower rates reduce discount rates for future earnings, supporting valuations. Higher rates create competition from bonds and increase borrowing costs. Fed communication drives substantial volatility around meetings. The basic concepts are described in the article fundamental analysis .
Corporate earnings ultimately determine long-term index trajectory. Earnings season creates concentrated volatility as companies report quarterly results. Aggregate earnings growth supports index appreciation while declining earnings pressure prices.
Economic data releases move markets through growth and policy implications. Employment reports, inflation readings, and GDP figures affect both earnings expectations and Fed policy trajectory. Consistent data watching reveals market sensitivity patterns.
Trading Instruments
SPY ETF provides straightforward index exposure through equity markets. High liquidity ensures tight spreads and reliable execution. Options chains offer leveraged and hedging strategies. Dividend payments provide income component for holders.
ES Futures on CME enable leveraged exposure with capital efficiency. Nearly 24-hour trading captures global developments. Quarter-end rolls require attention to avoid delivery. Micro contracts reduce size requirements for smaller accounts.
CFDs offer flexible sizing and extended hours through broker platforms. Overnight financing costs accumulate for longer holds. Spread widening during volatile periods affects execution. Regulatory protections vary by jurisdiction.
Technical Analysis
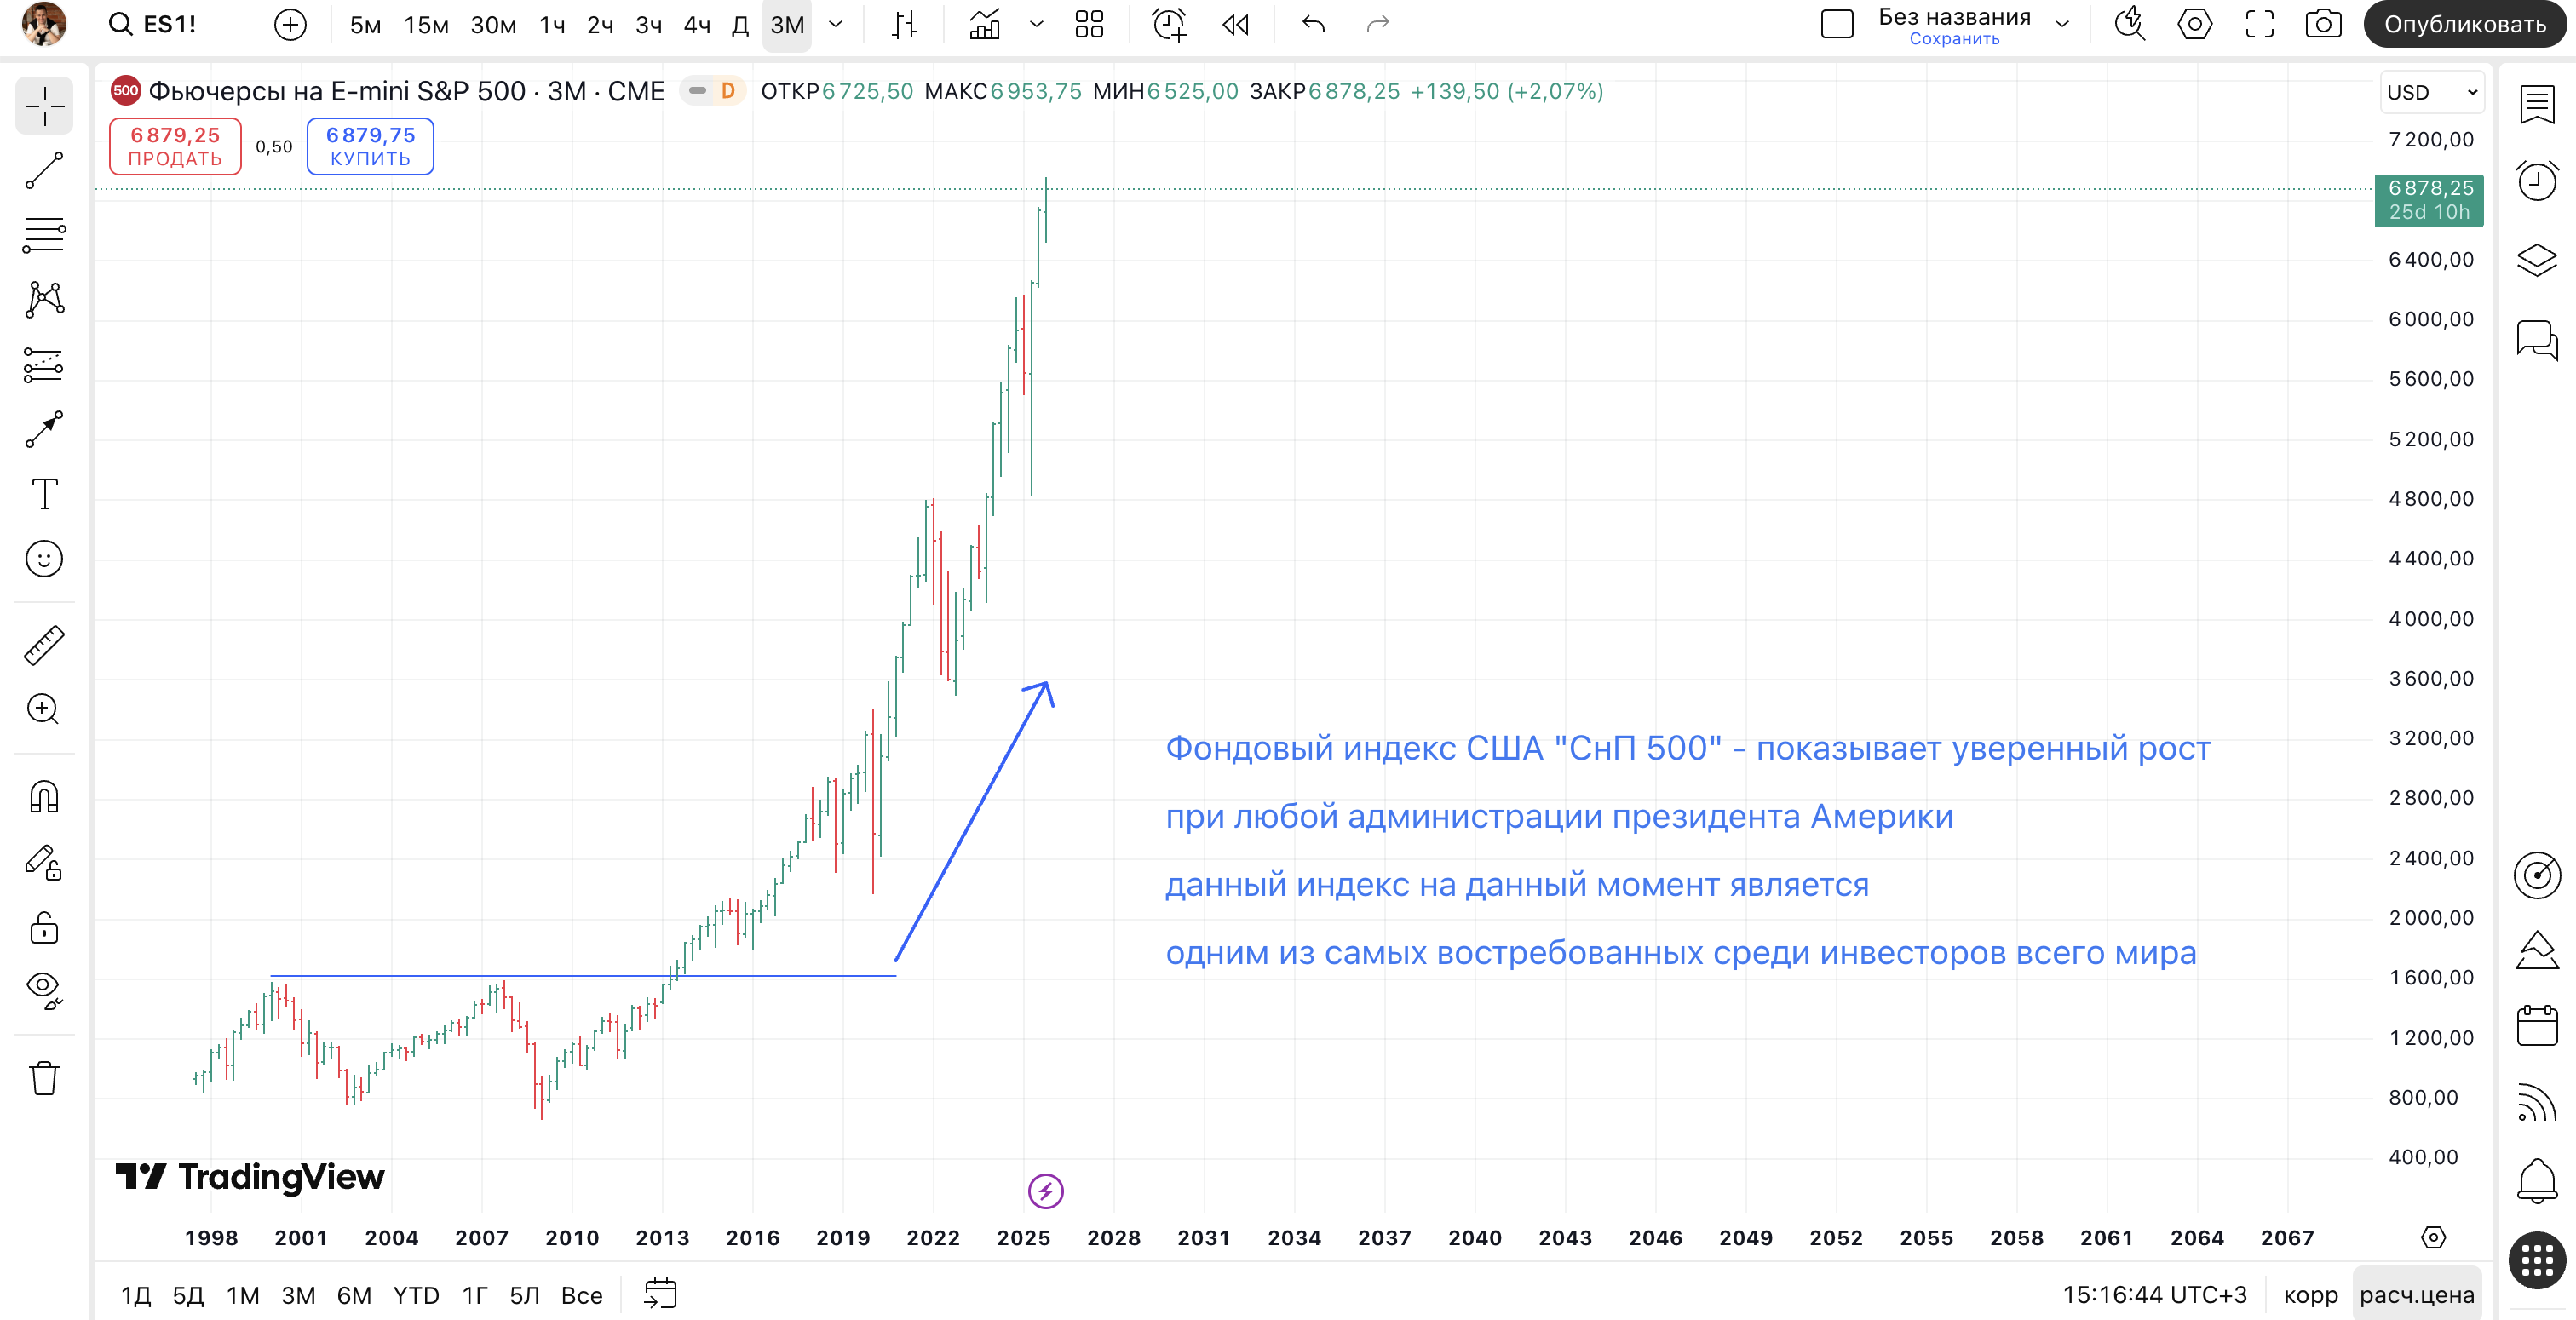
The S&P 500 trends well due to structural bias toward appreciation and consistent institutional participation. Long-term uptrend reflects economic growth and corporate earnings expansion. Corrections within uptrends offer buying opportunities for trend-following approaches. To understand this process more deeply, I recommend studying technical analysis.
Moving averages define trend structure effectively. The 50 and 200-day averages separate bullish from bearish conditions. Golden crosses and death crosses generate widely-watched signals. Price relationship to these averages guides positioning.
Historical all-time highs act as significant levels. Breaking to new highs often triggers continuation as resistance converts to support. Round numbers in price and milestone levels attract attention and orders.
Volatility Dynamics
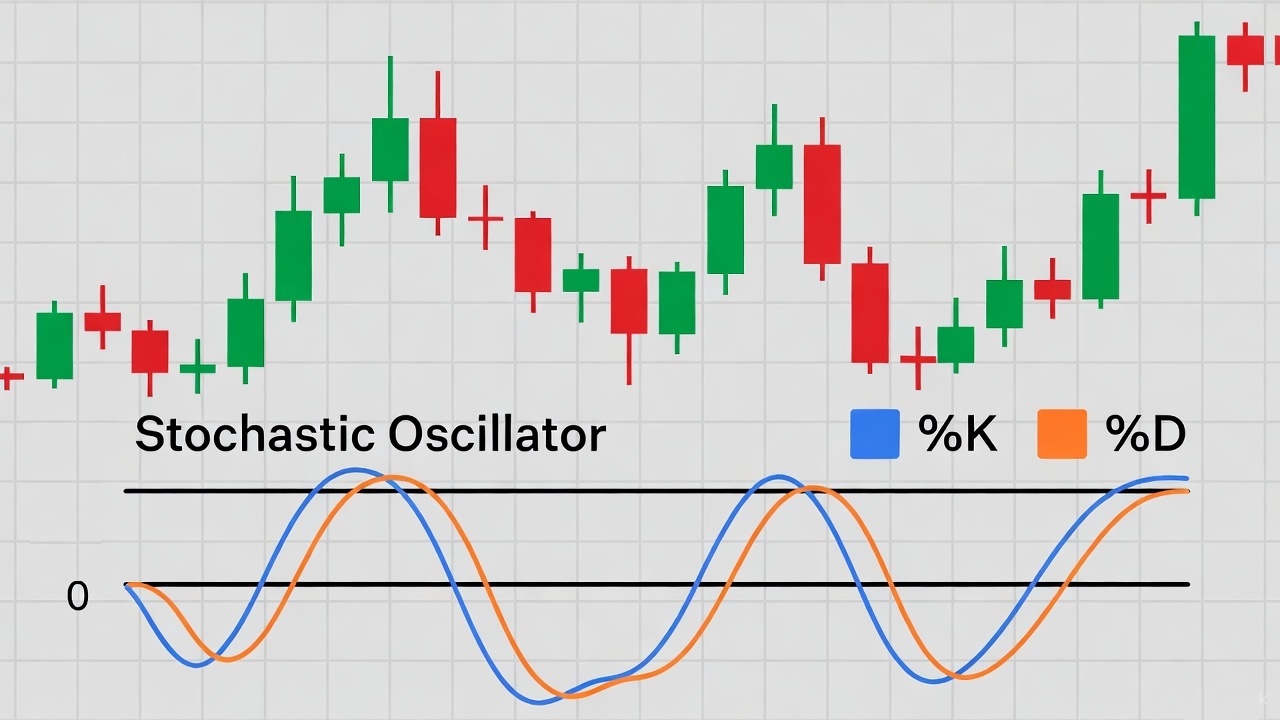
The VIX measures implied volatility from S&P 500 options. Low VIX environments suggest complacency, often preceding corrections. Elevated VIX indicates fear and typically accompanies selloffs. Mean reversion in VIX informs contrarian positioning.
Average daily ranges of 0.5-1.5% represent normal conditions. VIX above 20 signals elevated uncertainty requiring adjusted position sizing. Crisis periods can see 5-10% daily swings demanding extreme caution or reduced exposure.
Risk-on environments favor equity exposure with compressed volatility. Risk-off shifts trigger rapid volatility expansion and price declines. Monitoring risk sentiment across asset classes provides advance warning of regime changes.
Session Dynamics
US market open at 9:30 AM EST generates highest volume and volatility. Opening hour often sees directional moves as overnight positioning adjusts. Fading opening gaps when stretched offers mean reversion opportunities.
Midday consolidation typically features reduced volatility and range-bound action. Breakout attempts during low-volume periods frequently fail. Patient traders await afternoon momentum for directional plays.
Final hour brings renewed activity as institutions adjust positions. MOC imbalances can drive significant late moves. Understanding closing dynamics prevents adverse fills and captures closing momentum.
Sector Rotation
Sector rotation shifts leadership based on economic cycle position. Early cycle favors cyclicals and financials. Late cycle shifts toward defensives. Understanding rotation patterns provides context for index movements.
Technology sector dominance means tech rotation significantly impacts index performance. Rotation from growth to value creates index headwinds despite underlying strength elsewhere. Sector ETF relative performance reveals rotation trends.
Risk Management
Index diversification reduces but doesn't eliminate risk. Systemic events affect all components simultaneously. Position sizing should account for potential 5-10% corrections occurring within weeks during adverse conditions.
Event risk from scheduled releases requires attention. FOMC decisions, employment reports, and major earnings create known volatility windows. Reducing exposure or widening stops before events prevents adverse outcomes.
Overnight gaps occur despite extended futures trading. Global developments affecting US assets can gap cash markets at open. Position sizing should account for gap risk, particularly ahead of weekends and events.
Trading Strategies
Trend following captures the index's long-term upward bias. Buying dips to moving averages within uptrends provides favorable entries. Trailing stops protect profits while allowing trend continuation. Patience for setups improves risk-reward ratios.
Range trading suits consolidation periods between trends. Fading moves to range extremes captures mean reversion. Breakout confirmation exits range positions for trending approaches. Defined ranges provide clear invalidation levels.
Event trading around economic releases offers short-term opportunities. Positioning based on data expectations captures immediate reactions. Quick profit-taking acknowledges event volatility risks. Strict stops prevent extended adverse moves.
Conclusion
The S&P 500 remains the world's premier equity benchmark, offering traders and investors unparalleled liquidity, technical clarity, and exposure to American economic strength. Its deep order flow, diverse sector composition, and institutional participation create ideal conditions for multiple trading approaches.
Success trading the S&P 500 requires understanding fundamental drivers—Fed policy, corporate earnings, and macroeconomic data—alongside technical proficiency with moving averages, trend structures, and volatility dynamics. I also recommend studying Bitcoin ETF for the full picture. Risk management through position sizing, stop placement, and event awareness separates profitable traders from those who struggle.
Whether trading SPY, ES futures , SPX options, or CFDs, consistent application of proven strategies on demo accounts before live trading remains essential. The index's structural uptrend bias rewards disciplined trend-followers while punishing careless risk-taking. Master the fundamentals, respect market dynamics, and the S&P 500 offers exceptional opportunities for traders committed to continuous improvement.
Frequently Asked Questions
The S&P 500 tracks 500 largest US public companies by market capitalization. It represents approximately 80% of total US equity market value and serves as primary benchmark for US stock performance.
Trading options include: SPY ETF for direct exposure, ES futures for leverage, SPX options for derivatives, and CFDs through brokers. Each instrument has different margin requirements and trading hours.
Key drivers: Federal Reserve policy, corporate earnings, economic data (jobs, GDP, inflation), sector rotation, and global risk sentiment. Technology sector has outsized impact due to weighting.
Peak activity occurs at US market open (9:30 AM EST) and close (4:00 PM EST). Economic data releases and Fed announcements create specific volatility windows.
Average daily range is 0.5-1.5%. VIX above 20 signals elevated volatility. Major events can cause 2-5% daily moves. Lower volatility than individual stocks due to diversification.
About the Author
Author: Igor Arapov — independent researcher in trading psychology and behavioral finance, practising trader since 2013, founder of arapov.trade, author of a trading book series (Open Library ), (ORCID: 0009-0003-0430-778X ).