Among technical analysis tools, Ichimoku Kinko Hyo stands as perhaps the most comprehensive single indicator available to traders. Translating to "equilibrium chart at a glance," this Japanese system delivers trend direction, momentum, and support/resistance levels simultaneously. While its multiple lines initially overwhelm newcomers, mastery rewards traders with exceptional market insight.
Japanese journalist Goichi Hosoda developed Ichimoku through thirty years of research, publishing the system in 1969. His meticulous approach created an indicator that remains relevant decades later across all tradeable markets. From equities to cryptocurrencies, Ichimoku provides consistent analytical framework regardless of the underlying asset. To understand this topic more deeply, I recommend studying technical indicators.
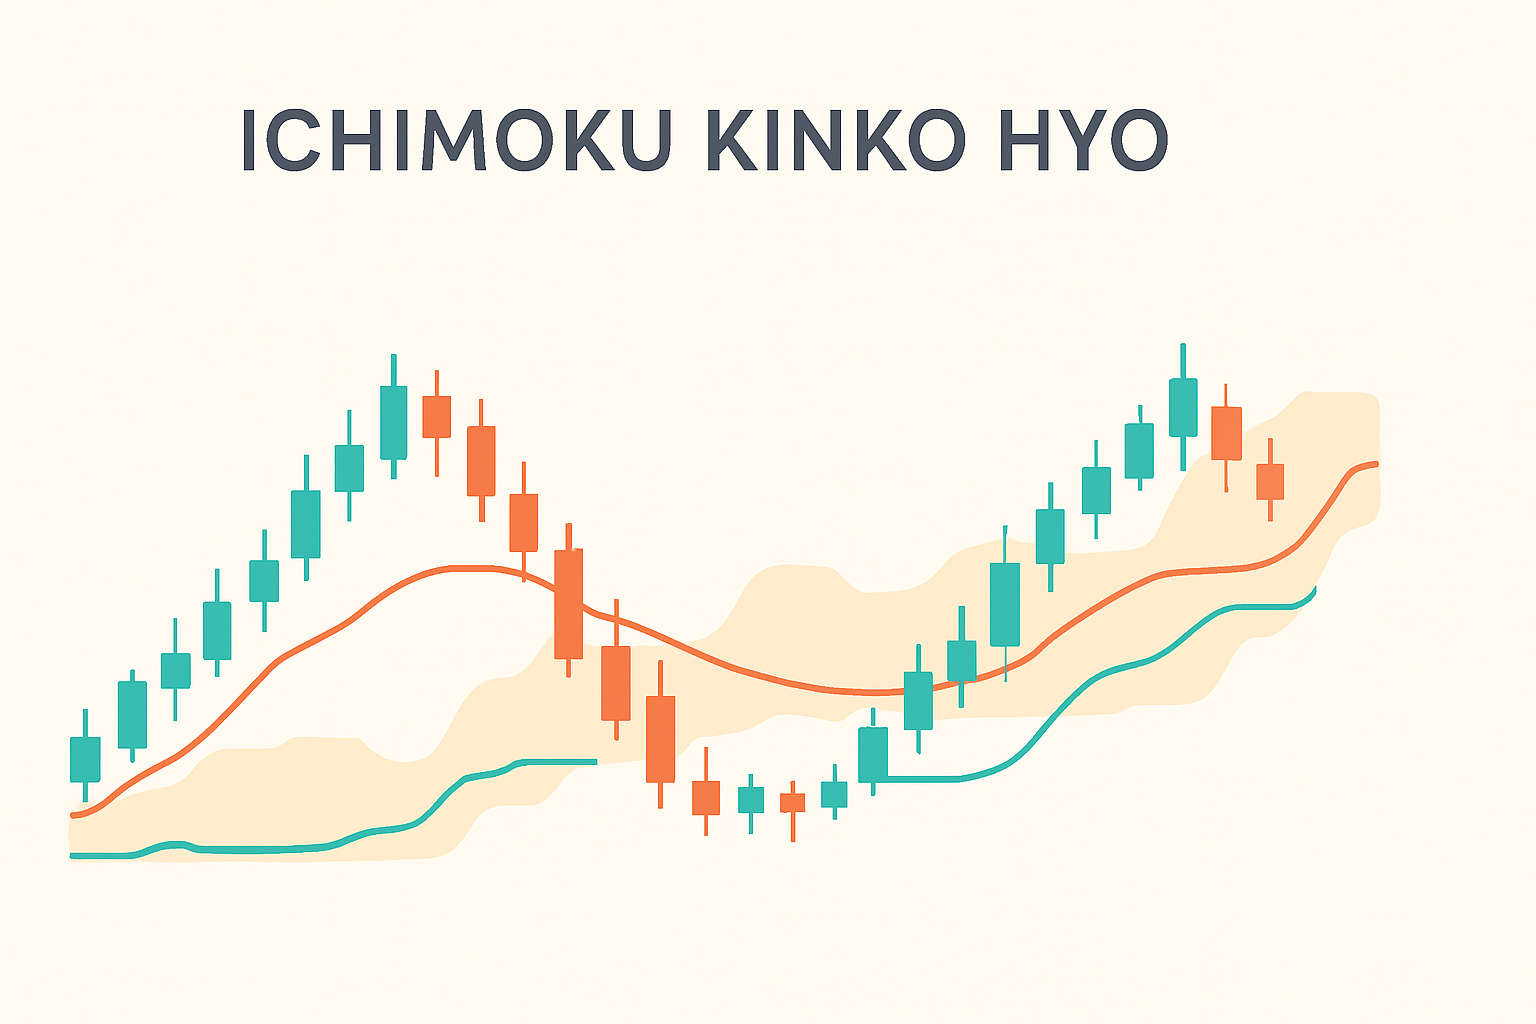
The Five Lines Explained
Tenkan Sen serves as the conversion or fast line, calculated as the midpoint between highest high and lowest low over nine periods. This line tracks short-term price equilibrium, moving closest to current price action. Its direction reveals immediate momentum while its slope indicates trend strength.
Kijun Sen represents the base or standard line using twenty-six periods for its calculation. This slower-moving line reflects medium-term equilibrium and acts as dynamic support or resistance. Pullbacks frequently terminate at Kijun, making it valuable for identifying entry opportunities within established trends.
Senkou Span A plots the average of Tenkan and Kijun projected twenty-six periods into the future. This leading line forms one boundary of the cloud, responding more quickly to price changes due to its Tenkan component. Its projection provides advance warning of upcoming support or resistance zones.
Senkou Span B uses the fifty-two period midpoint, also projected twenty-six periods ahead. This more stable line forms the cloud's second boundary, changing direction less frequently than Span A. Its flatter nature provides stronger support or resistance levels when tested.
Chikou Span plots current closing price shifted twenty-six periods backward. This lagging line enables direct comparison between current price and historical levels, confirming momentum direction and signal validity. Its position relative to past price action validates or invalidates trading signals. I also recommend studying moving averages for a complete picture.
Understanding the Kumo Cloud
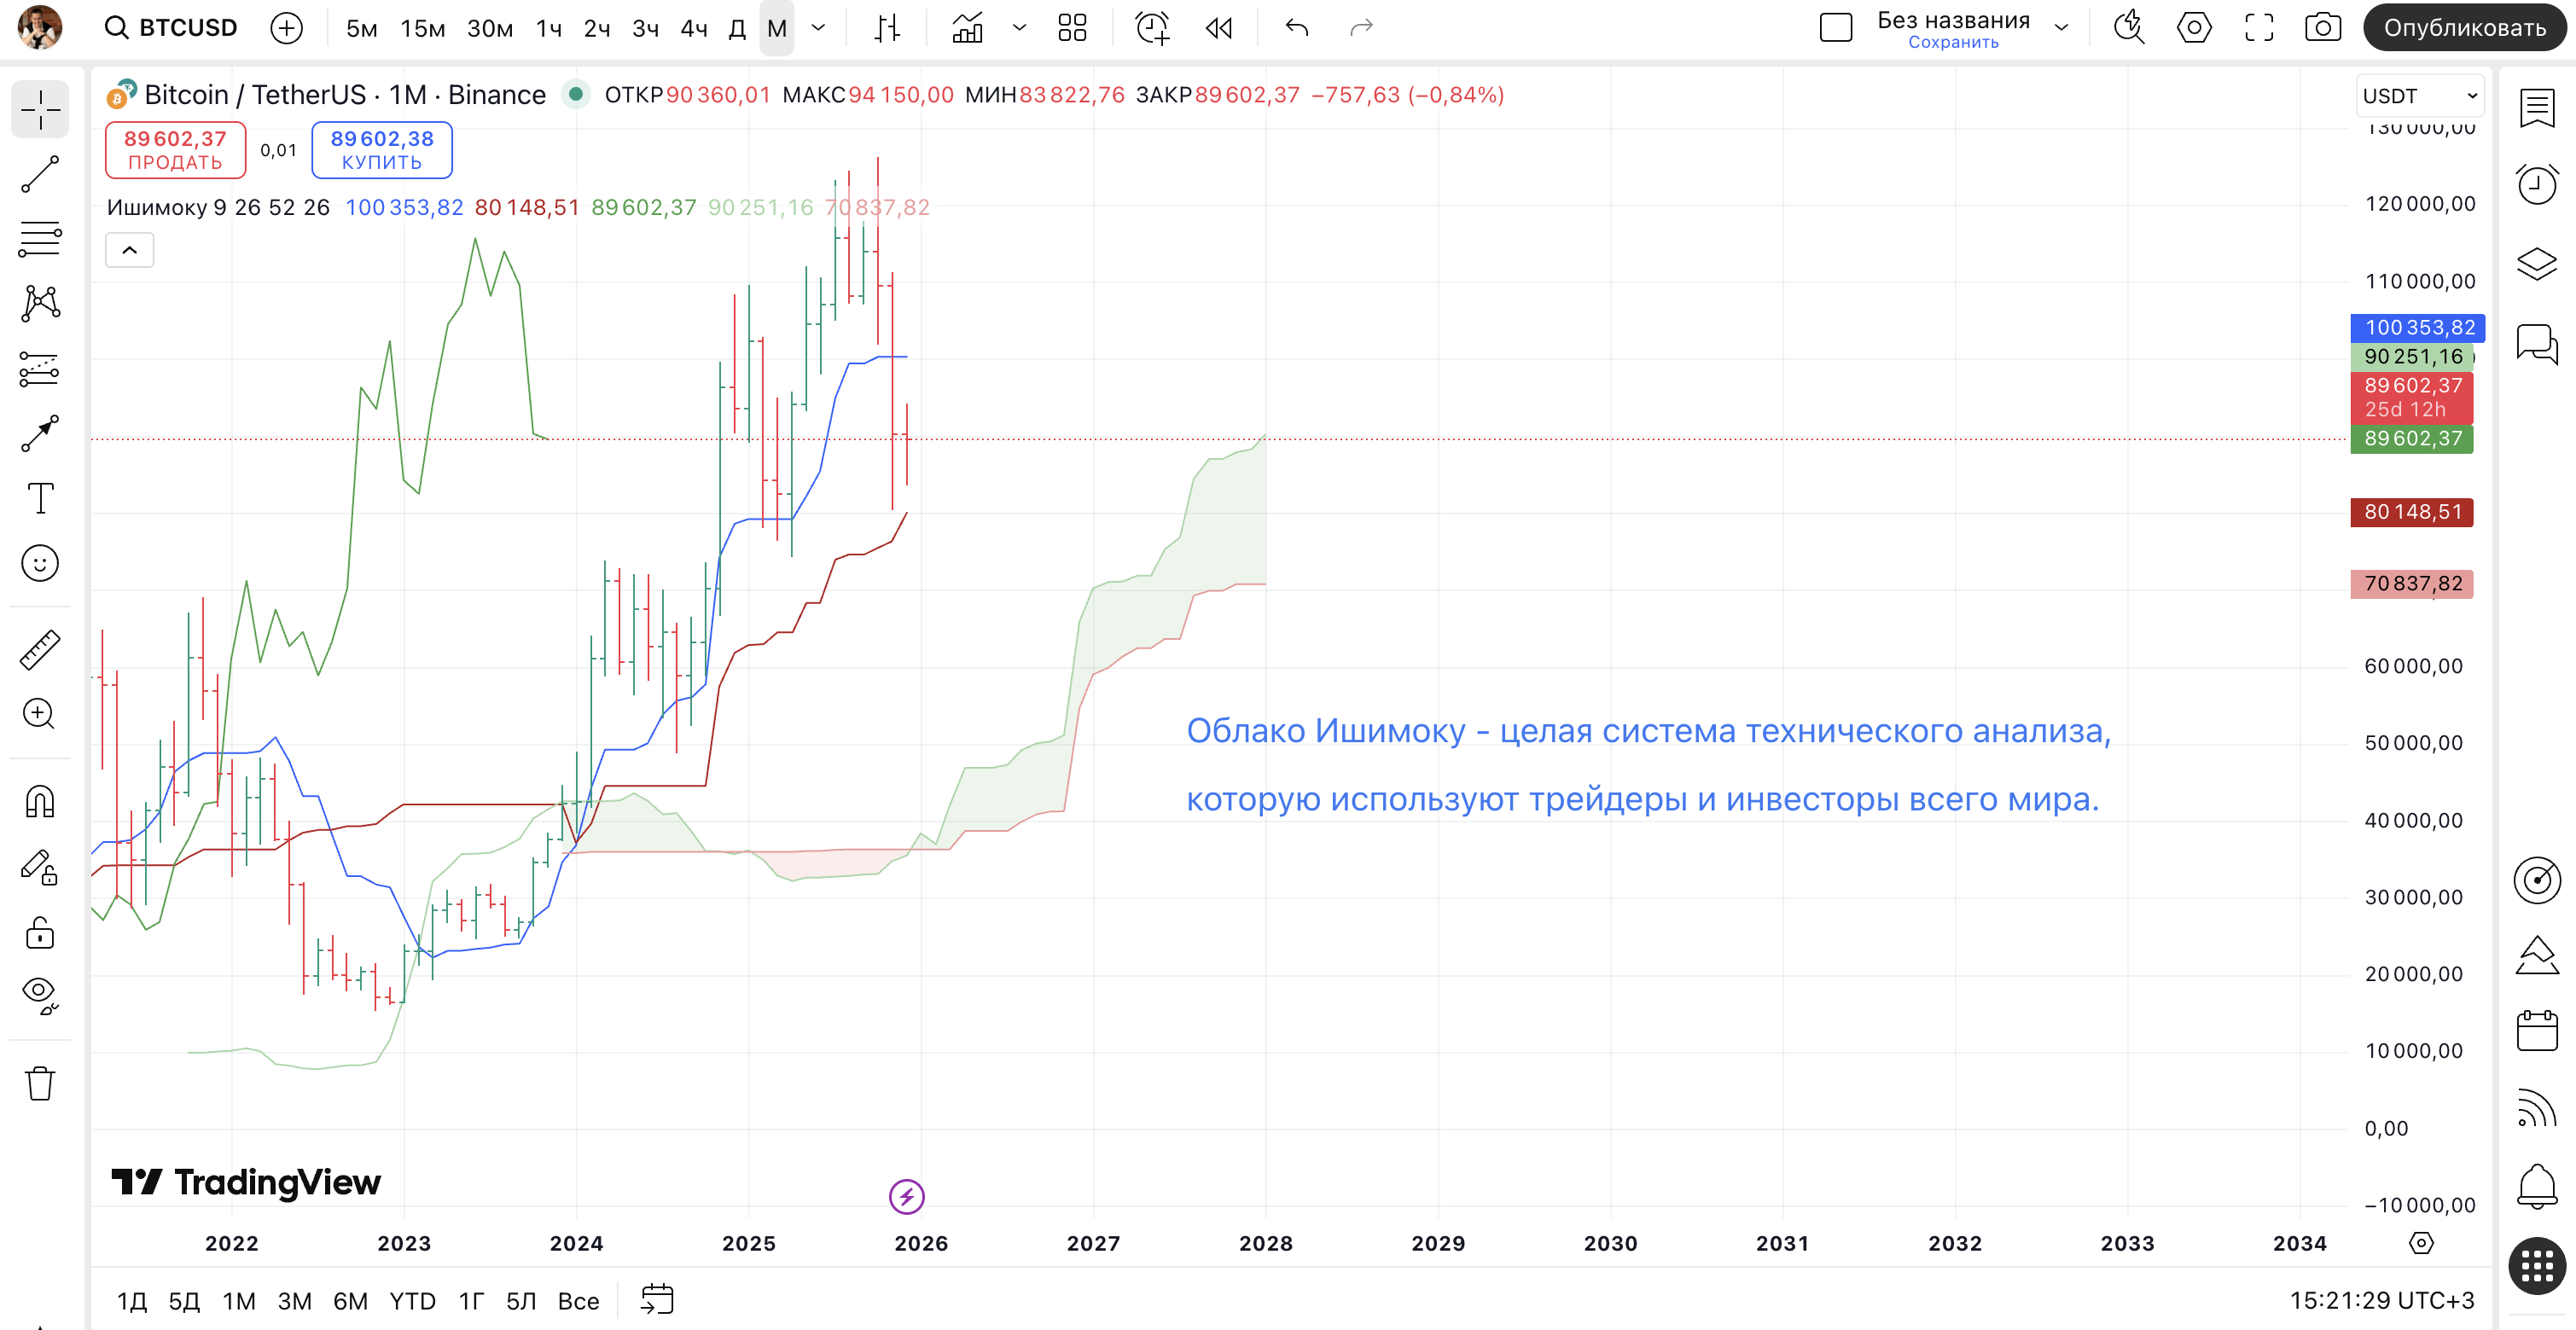
The Kumo cloud represents Ichimoku's defining feature—the shaded region between Senkou Span A and B. This cloud visualizes support and resistance zones extending into the future, allowing traders to anticipate where price will encounter obstacles. Cloud characteristics provide essential context for all other signals.
Cloud thickness directly correlates with zone strength. Thick clouds represent substantial support or resistance requiring significant momentum to penetrate. Thin clouds suggest weakness and easier breakout potential. Points where Span A and B cross, called Kumo twists, mark areas of minimal resistance and potential trend change zones.
Cloud color indicates underlying trend strength. Green clouds form when Span A trades above Span B, suggesting bullish conditions. Red clouds appear when Span B dominates, indicating bearish pressure. Color changes signal shifting momentum even before price confirms direction changes.
Trend Identification Framework
Price position relative to cloud establishes primary trend bias. Trading above the cloud confirms uptrend conditions where buying opportunities should be prioritized. The cloud transforms into support zone, with pullbacks toward upper boundary offering entry points for long positions.
Price below cloud confirms downtrend dominance. Short positions align with prevailing conditions while the cloud becomes resistance. Bounces toward lower cloud boundary provide selling opportunities within the bearish structure. Fighting this directional bias typically produces poor results.
Price within the cloud signals consolidation or trend transition. Trading during these periods carries elevated risk as direction remains unclear. Patient traders await definitive cloud exit before establishing new positions, accepting slightly worse entries for substantially improved probability.
Cloud slope reinforces directional assessment. Ascending cloud structure supports bullish positioning as future support rises. Descending slope favors bears with declining resistance. Horizontal cloud orientation suggests ranging conditions requiring different tactical approaches.
The TK Cross Signal
Tenkan crossing Kijun generates the TK Cross—Ichimoku's primary entry signal. Bullish crosses occur when faster Tenkan moves above slower Kijun, suggesting upward momentum acceleration. Bearish crosses see Tenkan dropping below Kijun as downward pressure intensifies.
Signal strength depends critically on cloud position. Bullish TK cross above cloud represents strong buy signal with trend confirmation. Same cross within cloud produces neutral signal requiring additional confirmation. Below cloud, bullish cross signals potential counter-trend bounce with limited upside expectations.
Cross quality matters significantly. Clean, angular crossings indicate decisive momentum shifts worth trading. Tangled, horizontal line interactions suggest indecision and unreliable signals. Separation distance following cross reveals move strength—wider gaps confirm stronger impulse (trend movement ).
Chikou Span Confirmation
Chikou trading above price from twenty-six periods ago confirms bullish momentum. This validation supports long positions and TK cross buy signals. Current strength exceeds historical levels, suggesting trend continuation probability. Absence of confirmation warns of potential reversal.
Chikou below historical price confirms bearish momentum supporting short positions. Current weakness relative to past prices increases downtrend continuation probability. Bearish TK crosses gain credibility with Chikou confirmation below prior price levels.
Chikou crossing price represents potential reversal signal. Upward crosses suggest momentum shifting positive, particularly when occurring above cloud. Downward crosses warn of momentum deterioration. Cloud interaction by Chikou provides additional confirmation—breaking through past cloud validates trend change.
Kumo Breakout Strategy
Kumo breakout occurs when price penetrates cloud boundaries, generating powerful directional signals. Upward breakouts through cloud resistance, especially following extended consolidation, trigger long entries. Entry on candle close above cloud with stop below opposite boundary provides favorable risk structure.
Downward breakouts carry equal significance for establishing short positions. Closing below cloud support after price struggled within cloud confirms bearish resolution. Stops above cloud upper boundary protect against false breakdowns while allowing position development.
Breakout reliability increases with confirming factors. Thick cloud penetration demonstrates strong momentum. TK alignment with breakout direction adds confirmation. Chikou clearing past price levels validates move. Multiple confirmations justify larger position sizing.
Timeframe Considerations
Higher timeframes produce more reliable Ichimoku signals due to reduced noise. Daily and weekly charts generate actionable signals suitable for swing and position trading. Monthly charts reveal major trend structure for long-term positioning.
Intraday application requires experience and stricter filtering. Noise increases, false signals multiply, and cloud characteristics become less reliable. Successful intraday usage aligns lower timeframe signals with higher timeframe trend direction, trading only when multiple timeframes agree.
Multiple timeframe analysis enhances Ichimoku effectiveness. Establish trend direction on weekly charts, identify trading zones on daily, and time entries on four-hour. This layered approach filters low-probability setups while confirming high-probability opportunities.
Parameter Optimization
Standard settings of 9, 26, 52 derive from Japanese trading weeks and months. These parameters work well across most markets and timeframes. Before adjusting, traders should thoroughly understand default behavior as basis for comparison.
Alternative settings adapt to different market characteristics. Cryptocurrency markets using 10, 30, 60 account for continuous trading. Shorter parameters like 7, 22, 44 suit faster-moving forex markets. Longer settings smooth signals but delay entries—tradeoffs require evaluation for specific strategies.
Backtesting validates parameter changes before live implementation. Optimization should improve signal quality without curve-fitting to historical data. Robust parameters perform consistently across different market conditions rather than perfectly fitting past behavior.
Common Implementation Errors
Trading against cloud direction produces consistent losses. Buying below cloud or selling above ignores Ichimoku's core message. Respect cloud position as primary filter, reserving counter-trend trades for experienced practitioners with proven edge.
Ignoring Chikou confirmation leads to premature entries. TK crosses without momentum validation frequently reverse. Patience for full signal alignment improves win rate substantially even if some moves are missed entirely.
Overtrading within cloud depletes capital during uncertainty. Cloud residence indicates absence of trend—forcing trades during consolidation guarantees losses over time. Wait for resolution before committing capital, accepting that sideways markets simply aren't tradeable.
Integration with Other Methods
Ichimoku complements rather than replaces other analysis methods. Volume confirmation strengthens cloud breakout signals. Support and resistance from other methods aligning with cloud boundaries increases zone significance. Multiple methodology confluence generates highest probability setups.
Candlestick patterns at cloud boundaries provide precise entry timing. Reversal patterns at cloud support within uptrends offer excellent long entries. Engulfing patterns following TK crosses confirm momentum shift. Pattern recognition within Ichimoku framework sharpens execution.
Fundamental awareness improves Ichimoku application. Major news events can overwhelm technical structures temporarily. Scheduled announcements warrant position reduction regardless of chart setup. Technical and fundamental alignment produces optimal trading conditions.
Conclusion
Ichimoku Kinko Hyo represents a comprehensive trading system that integrates trend volume analysis, momentum, and price levels into a unified framework. While mastery requires dedication and practice, the reward is a powerful analytical apparatus applicable across all markets and timeframes.
Success with Ichimoku depends on understanding each component and how they interact. The cloud defines trend and zones, TK Cross generates entry signals, and Chikou confirms momentum. Combining this system with market structure and understanding the fundamentals of technical analysis transforms Ichimoku into the foundation of a profitable trading system.
Practical application demands discipline and consistency. Never trade against cloud direction. Wait for confirmation from multiple system components before entering positions. Ichimoku performs best on higher timeframes—daily and weekly charts—where signals prove more reliable and carry greater weight.
Backtesting on demo accounts develops pattern recognition and intuition about system behavior. Each market condition—uptrend, downtrend, or consolidation— presents unique opportunities and risks. Adaptability combined with patience transforms Ichimoku from elegant theory into profitable trading reality. Master this Japanese system, and you unlock consistent edge across all market conditions.
Frequently Asked Questions
Ichimoku Kinko Hyo is a comprehensive indicator showing trend direction, momentum, and support/resistance levels at a glance. Developed by Japanese journalist Goichi Hosoda after 30 years of research.
Kumo is the shaded area between Senkou Span A and B lines. It acts as dynamic support/resistance zone. Thick cloud indicates strong zone, thin cloud suggests weakness.
Price above cloud indicates uptrend. Price below cloud signals downtrend. Price inside cloud suggests consolidation or uncertainty. Cloud color confirms trend strength.
TK Cross occurs when Tenkan Sen crosses Kijun Sen. Bullish when Tenkan crosses above Kijun. Signal strength depends on position relative to the cloud.
Standard settings are 9, 26, 52 based on Japanese trading week. For crypto and forex, adapted settings like 10, 30, 60 or 20, 60, 120 are often used.
About the Author
Author: Igor Arapov — independent researcher in trading psychology and behavioral finance, practising trader since 2013, founder of arapov.trade, author of a trading book series (Open Library ), (ORCID: 0009-0003-0430-778X ).