MACD indicator explained: why it works worse than you expect
MACD is an indicator built on two moving averages that shows whether a move is speeding up or fading. It hands you signals through the crossover of its own lines. On your first trades they often look like they work, but over the long run they give no edge, and the account melts on spread and commission. So I keep MACD as an indicator of state and do not build an entry on it.
People ask me about MACD more than about any other indicator, and almost always in the same tone: here, at last, is a tool that works. I once thought so myself. So let me explain in plain words why MACD seems to work at the start and why the result over a long distance comes out different.
In this article we'll cover:
- MACD is built from the difference of two exponential averages plus a signal line, and at heart it is a smoothed derivative of price
- on the first trades the line crossovers often look precise, but over the long run the result is close to a coin toss
- MACD and the stochastic easily give contradictory signals, and there is no guessing which to obey
- in my experience the edge comes not from an indicator but from levels, volume and price action, the cause of the move rather than its trace
To talk in concrete terms, first look at what MACD is assembled from.
What is the MACD indicator and how is it calculated?
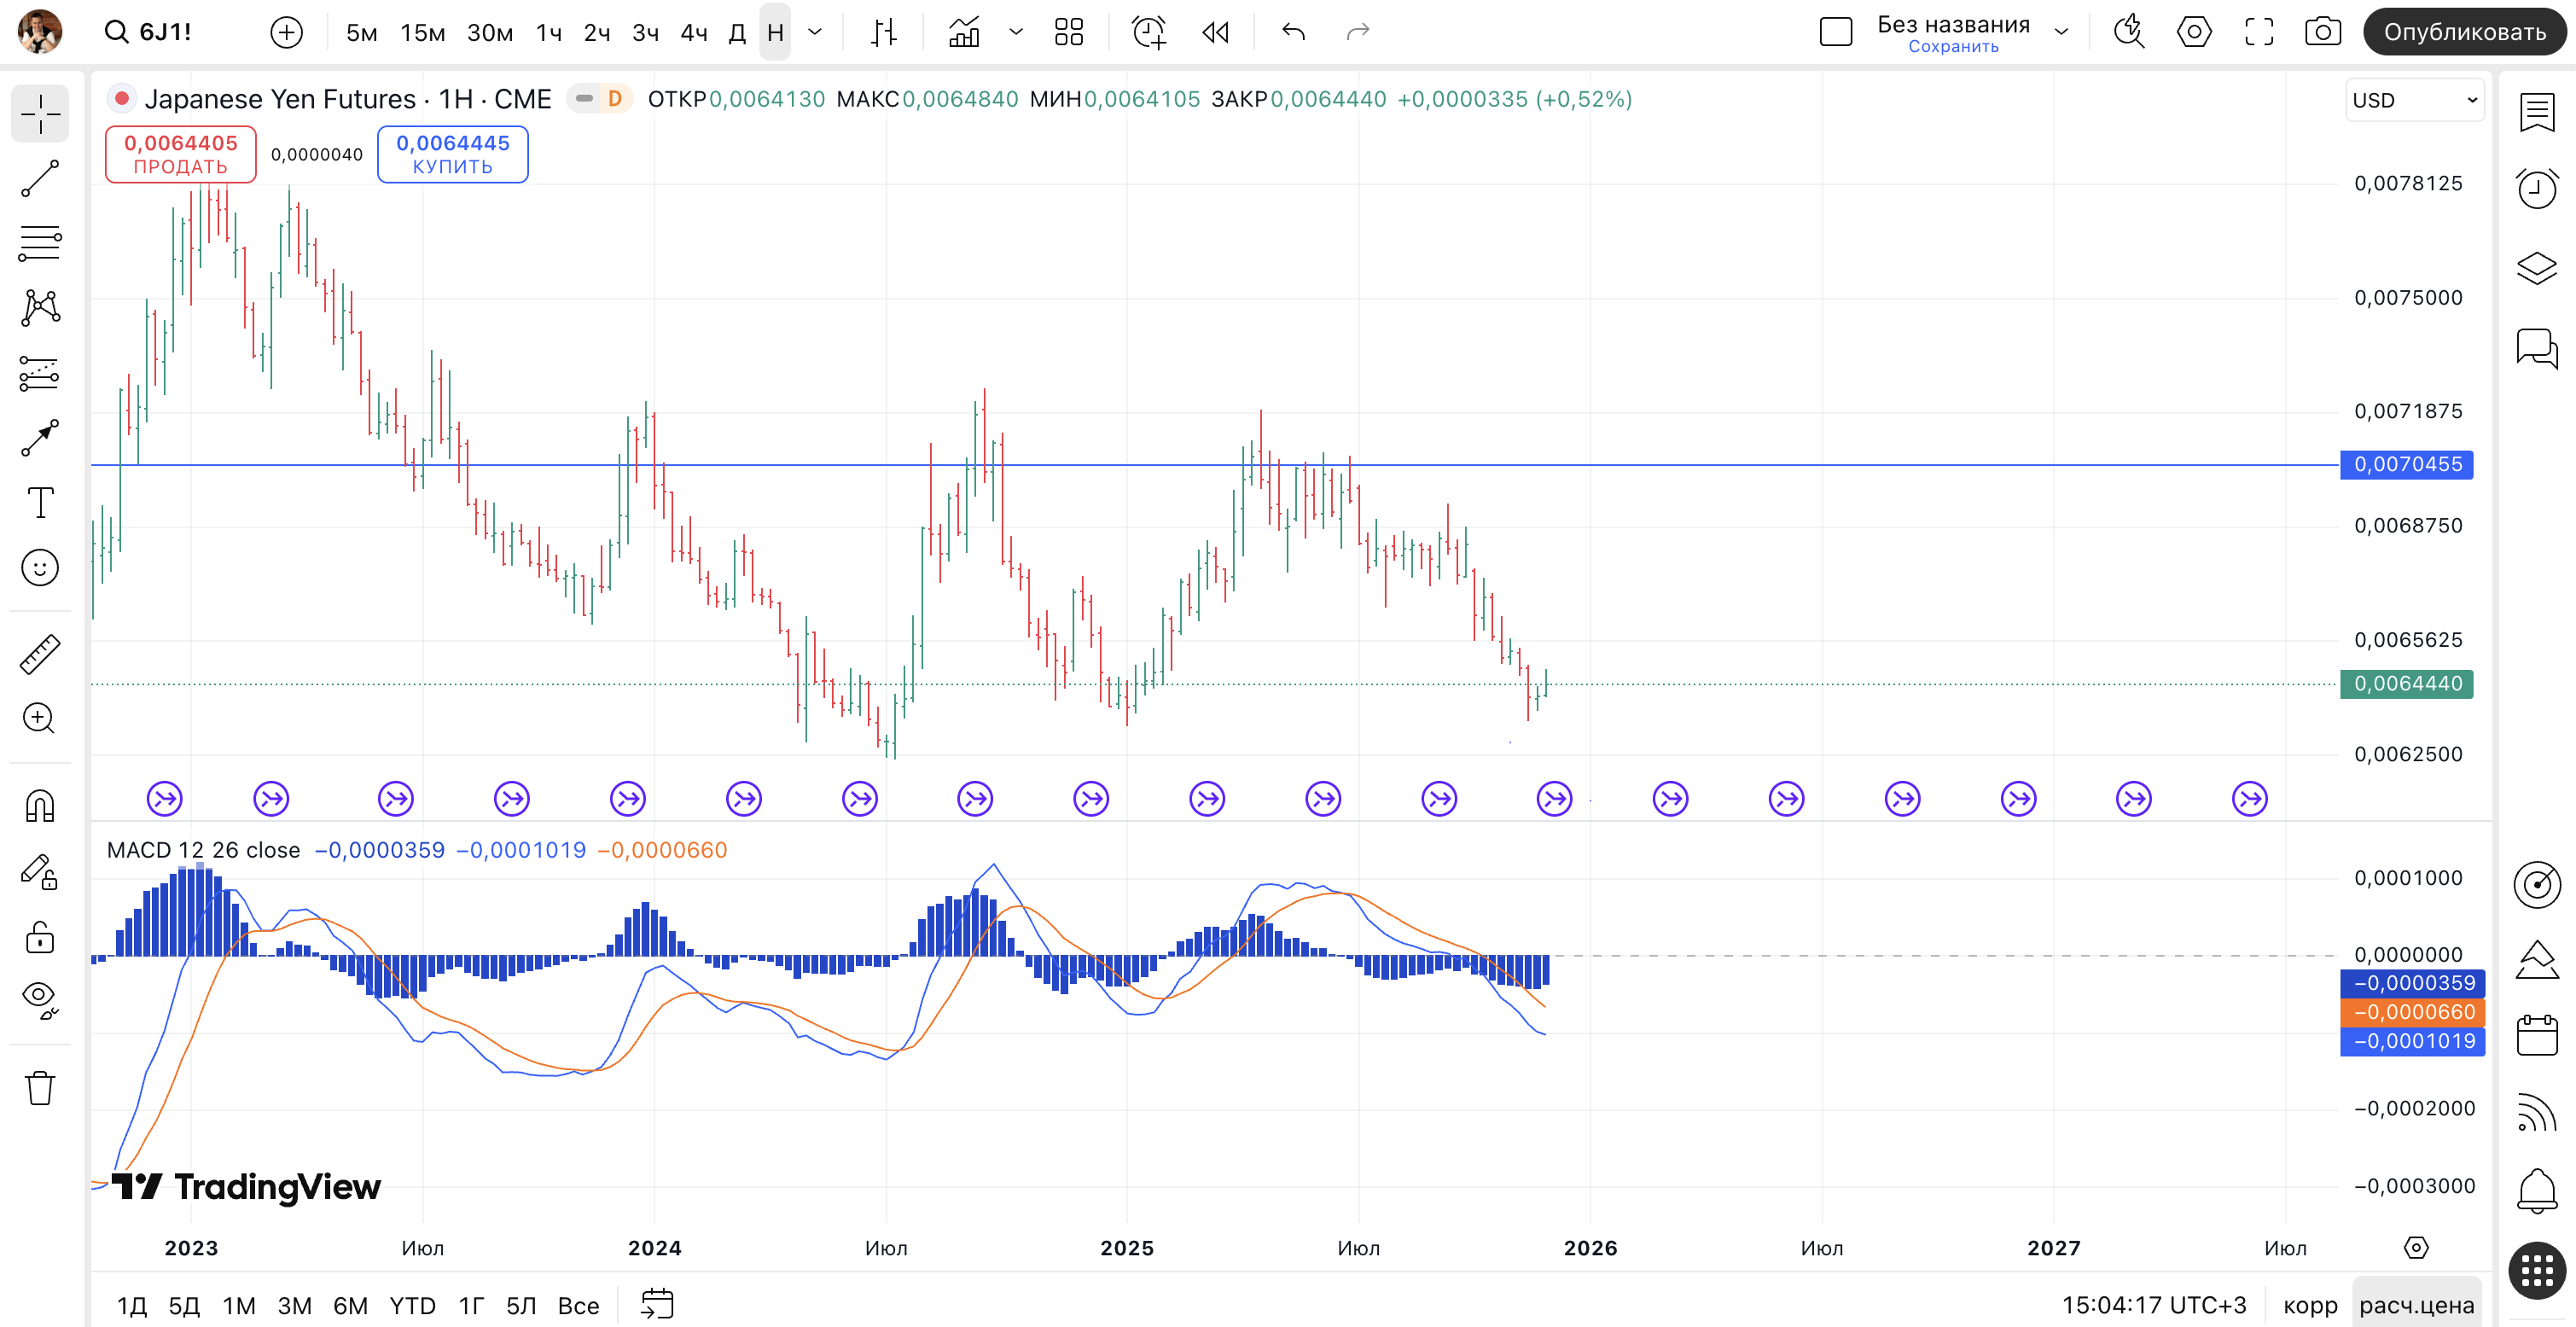
MACD is an indicator of the convergence and divergence of moving averages that shows the difference between a fast and a slow average. It was created by Gerald Appel in the late 1970s. The MACD line is worked out as the difference between a 12-period exponential average and a 26-period one. On top of it sits a signal line, a 9-period exponential average, and the gap between the two is drawn as the bars of a histogram.
The histogram is simply the difference between the MACD line and the signal line: the bars grow when the lines pull apart and shrink when they converge. Separately there is a zero line. When MACD is above zero, the fast average is above the slow one, which is read as a sign of growth; below zero, the reverse. It sounds like a ready-made system: wait for the crossover, watch which side of zero you are on, catch the divergence of the histogram. But all that neatness rests on a single assumption, that an averaged past will predict the future.
The idea runs like this. The slow average takes more bars and reacts lazily. The fast one takes fewer bars and turns sooner. While the slow one is only thinking about turning, the fast one has already turned, and at the point where they cross MACD issues its signal. It sounds logical, and that is the whole pull of the indicator: everything is clear and visual.
In short: MACD is the difference of the 12 and 26 averages plus the 9-period signal: visual and clear, but the whole neatness rests on the assumption that an averaged past will predict the future.
MACD signals: line crossover, histogram, the zero line, and divergence
Let me lay the signals out cleanly. The first is the crossover of the MACD line and the signal line: from below upward it is read as a buy, from above downward as a sell. The second is the MACD histogram, the gap between those two lines: growing bars say the momentum is building, shrinking bars say it is fading even before the crossover. The third is the zero-line cross: MACD moving above zero means the fast average has risen above the slow one (buyers in control), moving below zero the reverse.
Standing apart is MACD divergence, a mismatch between price and the indicator. A bearish divergence is when price prints a new high but MACD prints a lower one: the upward momentum is weakening even as price still crawls up. A bullish one is the reverse: price makes a new low while MACD makes a higher one, hinting that the sell-off is fading. Divergence is treated as one of MACD's more useful signals, because it shows up before a reversal rather than after. All of this looks like a set of ready-made rules, and that is exactly where the main question begins: do these signals work in practice. More on that below.
In short: The four basic MACD signals are the line crossover, the histogram (momentum strength), the zero-line cross, and divergence (a price-indicator mismatch, bullish and bearish); divergence is the most valuable of them because it leads the reversal.
MACD settings and timeframes, and which signal comes first
The default parameters are 12, 26 and 9, the numbers Appel himself used, and they are the sane place to start. Intraday traders sometimes shorten them, to 6, 13 and 5, for faster signals, but speed cuts both ways: more crossovers means more false ones. The timeframe works the same way, noisy on a one or five-minute chart and far cleaner on the daily and above. It is also worth knowing the signals do not arrive together: the histogram slope leads, the signal-line crossover most people watch comes next, the zero-line cross trails, though earliest here only means least late. None of it removes the core problem, it only shifts it: a quieter setting lags more, a faster one lies more.
In short: The default 12, 26, 9 is the place to start; faster settings and lower timeframes only add false crossovers; and among the signals the histogram slope leads while the zero-line cross trails, yet every one of them is still a lagging read of past price.
MACD vs the stochastic: the paradox of contradictory signals
What follows is from my practice, and it is my position. MACD really can hand you correct trades, and here I will put an asterisk. I remember a signal on the pound: price under a support level, a false break down (when price is deliberately driven past a level to collect stops), volume came in, the margin traders got shaken out, and the market turned up. MACD did not lie in that spot. But notice: what fired was not the indicator, it was the level, the volume and the false break. MACD only confirmed what was already visible on price.
And here is the paradox. Put MACD next to the stochastic, and you will regularly see one of them calling to buy and the other to sell. Which do you obey? You cannot guess, because both are calculated from the very same past price, just by different formulas. When two indicators contradict each other, the beginner adds a third, then a fourth, and the head fills with mush. The more lines on the chart, the less clarity.
Let me add why trying to assemble several indicators into a system does not save you. All oscillators are calculated from the same price, just by different formulas, so they do not give independent confirmations. When you line up MACD, the stochastic and RSI and wait for them to vote, you are essentially asking the same past price three times over. Whether they agree or not adds no new information. The illusion of confirmation is dangerous precisely because it instils confidence where there is none, and the beginner enters a trade bolder than they should.
In short: When MACD is right, what fires is not it but the level, the volume and the false break beneath it; and next to the stochastic it easily contradicts itself, since both are calculated from the same past price.
Why MACD lags and what works better
The reason for the lag is in the construction itself. A moving average averages past prices, and MACD is the difference of two such averages, that is, a second-order derivative of what the market has already done. So what happens to the account after a hundred or three hundred trades taken strictly by the indicator? In my experience it is wrong more often than it is right, and the account steadily shrinks, because spread and commission eat into an already fragile edge.
What works better? An analytical look at the market: supply and demand levels, volume, price action, following the trend. That is not the trace of price but its cause. Let me show what the replacement looks like in practice. Instead of crossovers I look at the level price has come up to and ask myself who is active here. If a spike of volume passes at strong support, price pokes the level down and comes straight back, that speaks of position-building by big capital far more honestly than any crossing of lines. MACD at that moment will at best repeat what is already visible on price, and at worst arrive late. So I start not with the indicator but with the question of where supply is now and where demand is. The indicator stays off to the side with that approach, and I lose nothing by it, rather the opposite, the picture gets cleaner. The breakdown of that very pound signal, and why I moved away from indicators, I show in the video where I take apart MACD on a real example, and the step-by-step replacement for the signal I gathered in the course section on indicators. And here is my main takeaway over the years: MACD is dangerous not because it is bad but because it is convincing. It is clear, it is pretty, and on the first run of trades it creates false confidence, which for a beginner costs more than any loss. I have traded a long time, and when I started I too looked for a grail in the crossing of lines, but an indicator is at best a confirmation, it will not think for you. If I were starting again, I would not spend time tuning MACD, I would learn to read levels and volume straight away. That is not advice to you personally, it is what I would do. There is useful in MACD too: it shows the fading of an impulse nicely through the narrowing of the histogram, but as a generator of entries it is, to my mind, overrated. The moving averages themselves are not the enemy, you just want to treat them as background rather than a command, and the same ailment, by the way, afflicts the RSI indicator.
In short: MACD lags by construction, it is a derivative of what the market has already done, so keep it at most for background, and look for the edge in levels, volume and price action.
How MACD fits into the wider job of reading a chart, I show in the big guide on the topic.
Frequently asked questions
MACD compares a fast and a slow moving average. When the fast one outruns the slow one, the line rises; when it falls behind, the line drops. The crossover of the MACD line and the signal line is treated as a buy or sell signal.
The classic parameters are 12, 26 and 9, proposed by the indicator's author. Shorter periods make MACD more sensitive and noisier, longer ones smooth the signals out. There is no point a beginner chasing some special setting.
It is cleaner on higher timeframes, the daily and above, where there is less noise. On one or five-minute charts MACD prints a stream of crossings that lead nowhere, so for intraday work it tends to mislead more than it helps. Either way it stays a lagging read of past price.
Because it is calculated from past prices and therefore lags. On a reversal and in a range it often draws the crossover after the move has already happened, so the signal turns out false. That is a property of the formula, not a settings error.
In my experience the edge comes from working with supply and demand levels, volume and price action. These tools show the cause of the move rather than its trace, and with that approach MACD is needed at most as background.
It is a mismatch between price and the indicator. A bearish divergence is when price makes a new high but MACD does not, hinting at weakening growth; a bullish one when price makes a new low but MACD does not. It is treated as one of the more useful signals because it shows up before a reversal, but it is no guarantee either: without confirmation from volume and a level I do not enter off it.
About the Author
Author: Igor Arapov — independent researcher in the psychology of investment decisions and behavioral finance, practising trader since 2013, founder of arapov.trade, author of a trading book series (ORCID: 0009-0003-0430-778X).