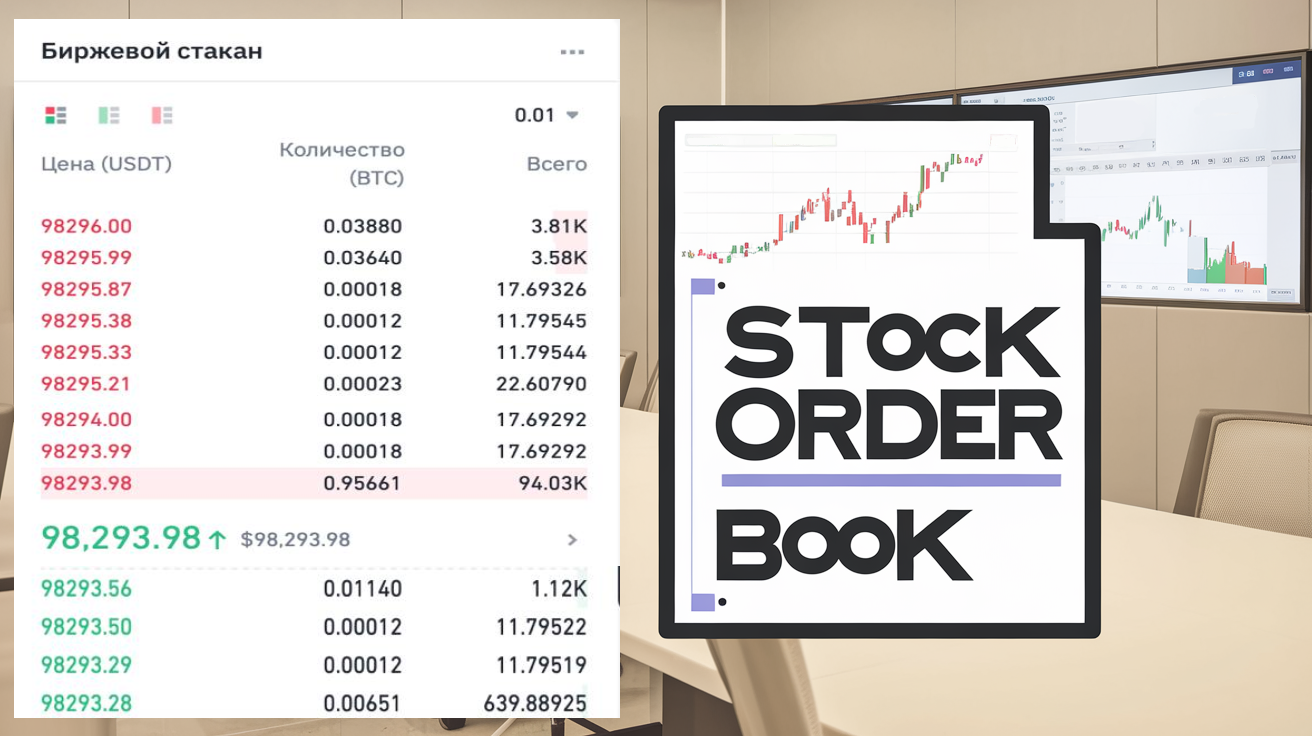
Most people read Bitcoin dominance as a signal: it went up, sell your alts; it went down, load up. I read it differently. BTC.D shows one thing only, where the market's money is sitting right now, in Bitcoin or in altcoins, and that is context for a decision, not the entry itself.
I trade crypto rarely; my bread and butter is futures and gold. But I keep Bitcoin in view at all times: it is the first to react to investor risk appetite, like a canary in a mine. Dominance adds one more layer. You see not just Bitcoin's price but where capital is flowing, into alts or back into Bitcoin. I have traded for years, and over that time I have learned to treat this number calmly, without hunting an altseason in every wiggle.
In this article we'll cover:
- dominance is Bitcoin's share of the crypto market cap, a map of money, not a trade signal;
- it is a ratio, not a price, so it can rise while Bitcoin falls and fall while Bitcoin rises;
- this derived number cannot be traded blind: stablecoins, token unlocks and different data sources distort it;
- I take it as context, and still look for the entry by levels and volume on the instrument itself.
Start with what this number actually measures and where it came from.
What is Bitcoin dominance on the crypto market
Bitcoin dominance is the percentage share of Bitcoin in the total capitalization of the whole crypto market. The math is simple: divide Bitcoin's market cap by the market cap of all cryptocurrencies and multiply by a hundred.
In the early years, when there were almost no other coins, dominance held near a hundred percent. Then thousands of altcoins appeared and Bitcoin's share fell, as you would expect. Its historic low, about a third of the market, came during the new-token boom in 2018. In June 2026 it holds around 57 percent, down from a peak near 65 percent a year earlier, with the total crypto market cap around 2.3 trillion dollars. To me Bitcoin is the main risk asset of crypto: it is the first to be bought when risk appetite is on and the first dumped when fear sets in. What Bitcoin itself is and how to analyze it I cover in the piece on Bitcoin in trading.
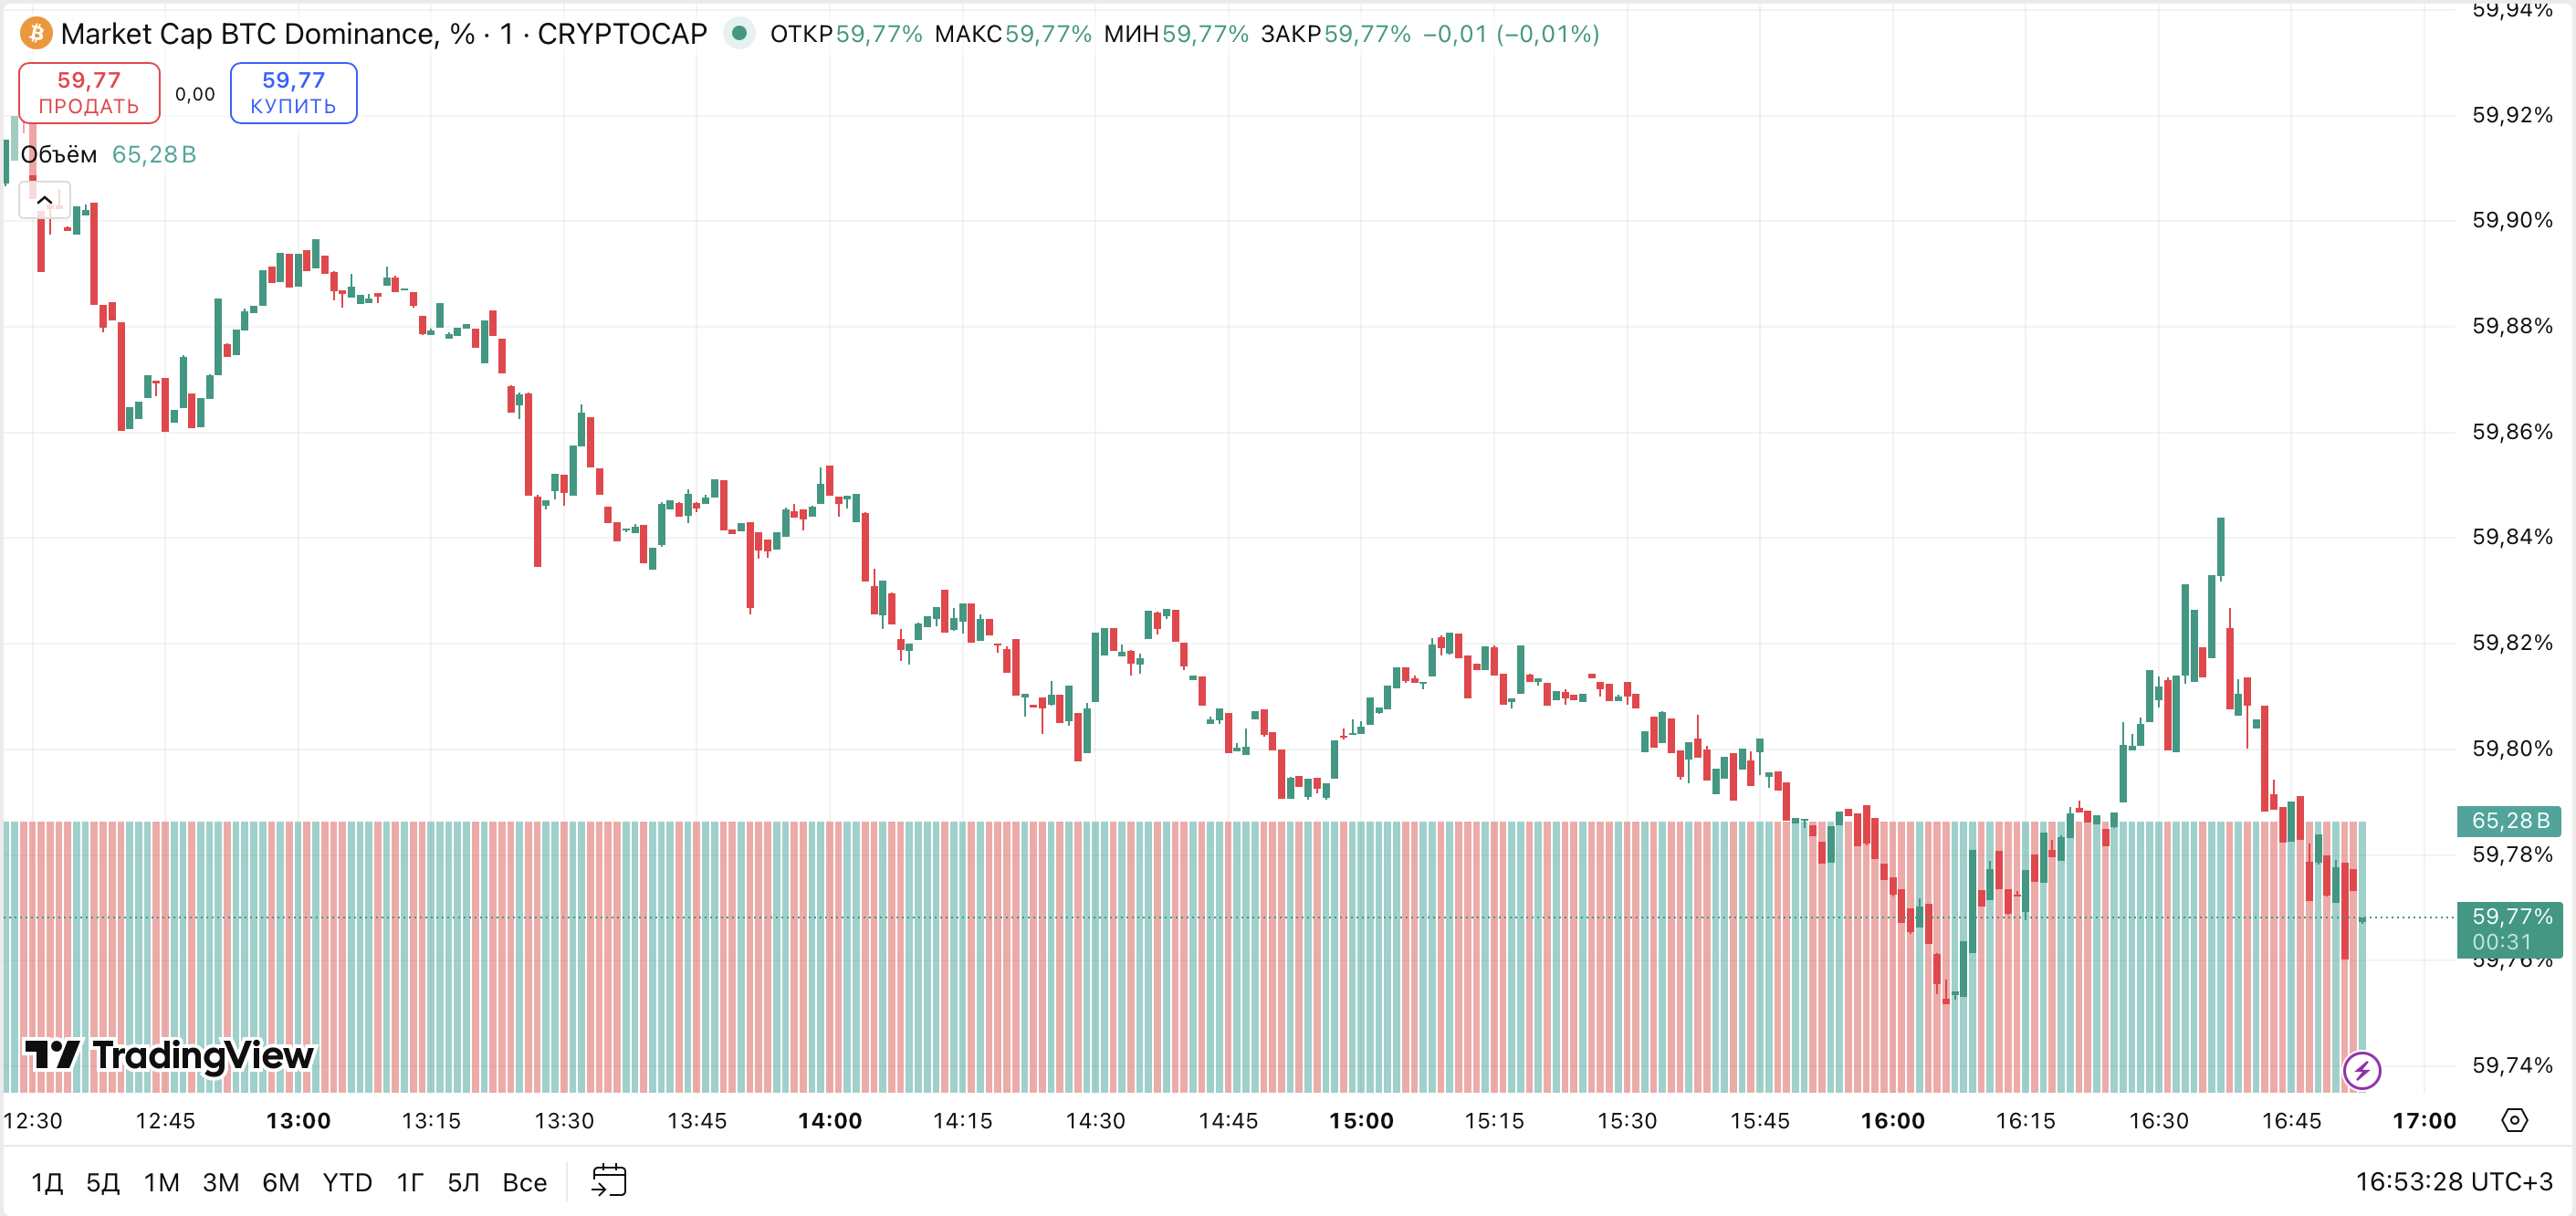
In short: BTC.D is Bitcoin's share of the market cap, around 57 percent in June 2026, and it is a map of money, not a price.
Why dominance and Bitcoin's price are not the same thing
This is the trap that catches almost every beginner, so it earns its own section. Dominance is a ratio, not a price. The figure can climb while Bitcoin's dollar price is falling, as long as altcoins are falling harder, and it can drop while Bitcoin is rising, if altcoins are rising faster. The number does not answer the question "is the price going up or down." It answers a different question: where is the marginal money going inside crypto, into Bitcoin or out into alts.
Lay the two axes side by side and you get four situations, and each says something different. Bitcoin up with dominance up means Bitcoin is leading and alts lag behind. Bitcoin up with dominance down is the textbook altseason, fresh money rotating into alts faster than into Bitcoin. Bitcoin down with dominance up is a flight to safety: alts are bleeding worse than Bitcoin while fear runs the floor. Bitcoin down with dominance down usually means capital is leaving the whole risk corner for stablecoins and cash. Read a single weekly candle on the dominance chart as "altseason is starting" and you have made the most common mistake on this metric. The regime, the multi-week direction, is what matters, not one bar.
In short: Dominance answers "Bitcoin or alts," price answers "up or down": the same dominance reading fits a rally or a sell-off, so never read it as a price signal.
How to read BTC.D: rising dominance and altseason
I suggest reading dominance like any ordinary chart: by trend and levels, not by guesswork. When it rises, capital is flowing into Bitcoin. More often than not that means investors are turning cautious and leaving riskier alts for what they see as the safer Bitcoin. In those stretches alts usually weaken, even if their own charts look neutral.
When dominance falls, it is the reverse: money moves into alts and they grow faster than Bitcoin. That stretch is what people call an altseason. What altcoins are and how they differ you can read in the piece on alternative blockchains. And here is where the beginner gets caught: he sees dominance dip and assumes every alt is about to fly. It does not work that way. Often it is a pump in two or three coins, not a broad rotation, and who is actually buying shows up in the volume, not in the dominance percentage. For the altseason itself there is a ready gauge, the altcoin season index: it is taken to begin when, over the last 90 days, about three quarters of the top fifty altcoins outperform Bitcoin. And one condition beginners skip: a real altseason starts when dominance falls while the total market cap is rising, because otherwise money is not coming into alts from outside, it is only rotating within. I read the dominance chart with the same eyes as any instrument: where is the trend, where is the key level, did the structure change or not. The logic of trend and range I cover in the course section on market phases.
In short: Rising dominance means capital is hiding in Bitcoin and alts weaken, falling dominance opens an altseason window, but confirm the entry with volume.
Why the number is shakier than it looks
Before you lean on dominance, know that the figure itself is softer than it pretends. The total market cap underneath it is alive, not a fixed denominator. A single large token unlock or a fresh high-valuation listing can move dominance even though no one bought or sold a single Bitcoin. So can stablecoins, and here the distortion is constant. Stablecoins are more than 300 billion in market cap, and because they grow with adoption but never appreciate, they shave Bitcoin's share by a few percentage points even when demand for Bitcoin itself has not changed at all. That is why some traders use real Bitcoin dominance, the same share with stablecoins stripped out, for a cleaner picture of money flowing between Bitcoin and speculative alts.
On top of that, the exact percentage differs from one site to the next. CoinMarketCap, CoinGecko and TradingView each track a different basket of assets and count the total a little differently, so the same moment can read as 57 on one and a point off on another. The practical lesson is plain: treat the digit loosely and trust the direction. I also keep stablecoin dominance, USDT.D, alongside it: when it rises, capital is sitting in cash and waiting, and its turn back down often lines up with risk appetite returning. To me that is one more layer of market mood, not a separate entry button.
In short: Stablecoins, token unlocks and data-source differences all move the percentage without a single Bitcoin trade, so read the direction, not the exact digit.
Bitcoin dominance and trading strategies: how to use it
The main rule I keep in mind: dominance is context, not an entry signal. It is a derived number, essentially the same kind of indicator as any other, and my view on indicators is well known: they lag and describe the past. In practice I look at dominance first to read the market regime, whether it is in a Bitcoin phase or an alt phase. That tells me what to keep in focus. But the entry into a specific trade I find not by dominance but by levels and volume analysis on the instrument itself.
My contrarian take is simple: dominance is more useful as a filter against needless trades than as a generator of entries. If it is climbing with conviction, I just understand that alts are out of favor right now and I do not reach for them without a reason. The risk I allow on alts I keep modest. This is not advice to you personally, it is how I operate, because this is the most volatile and dangerous corner of the market.
In short: Dominance is a filter, not a timer: it sets the market mood, while money is made by discipline at a level, not by chasing every wiggle of the percentage.
Frequently Asked Questions
It is Bitcoin's share of the whole crypto market cap, in percent. It shows where the money sits right now: in Bitcoin or in altcoins. It is not Bitcoin's price but its market share, around 57 percent in June 2026.
Most often that capital is leaving altcoins for Bitcoin, and the alts are weakening. It points to a cautious market mood. Falling dominance, the other way, hints at a possible altseason.
No. Dominance is a share, not a price. It can rise while Bitcoin's dollar price falls, as long as altcoins fall harder, and it can drop while Bitcoin rises if altcoins rise faster. The number tells you where money is rotating, not which direction prices are headed.
Each platform tracks a different set of coins and counts the total cap a bit differently, so the exact figure varies. Treat the percentage loosely and read the trend, not the second decimal.
In my experience, no, not as a standalone signal. It is context, not an entry point. The number is distorted by stablecoins and new tokens, and it lags. I look for the entry by levels and volume on the specific instrument.
There is no single correct value; the direction matters more. Historically it fell to about a third of the market and rose toward the 100 percent area in the early years. Watch the trend of dominance, not one frozen number.
About the Author
Author: Igor Arapov — independent researcher in the psychology of investment decisions and behavioral finance, practising trader since 2013, founder of arapov.trade, author of a trading book series (ORCID: 0009-0003-0430-778X).