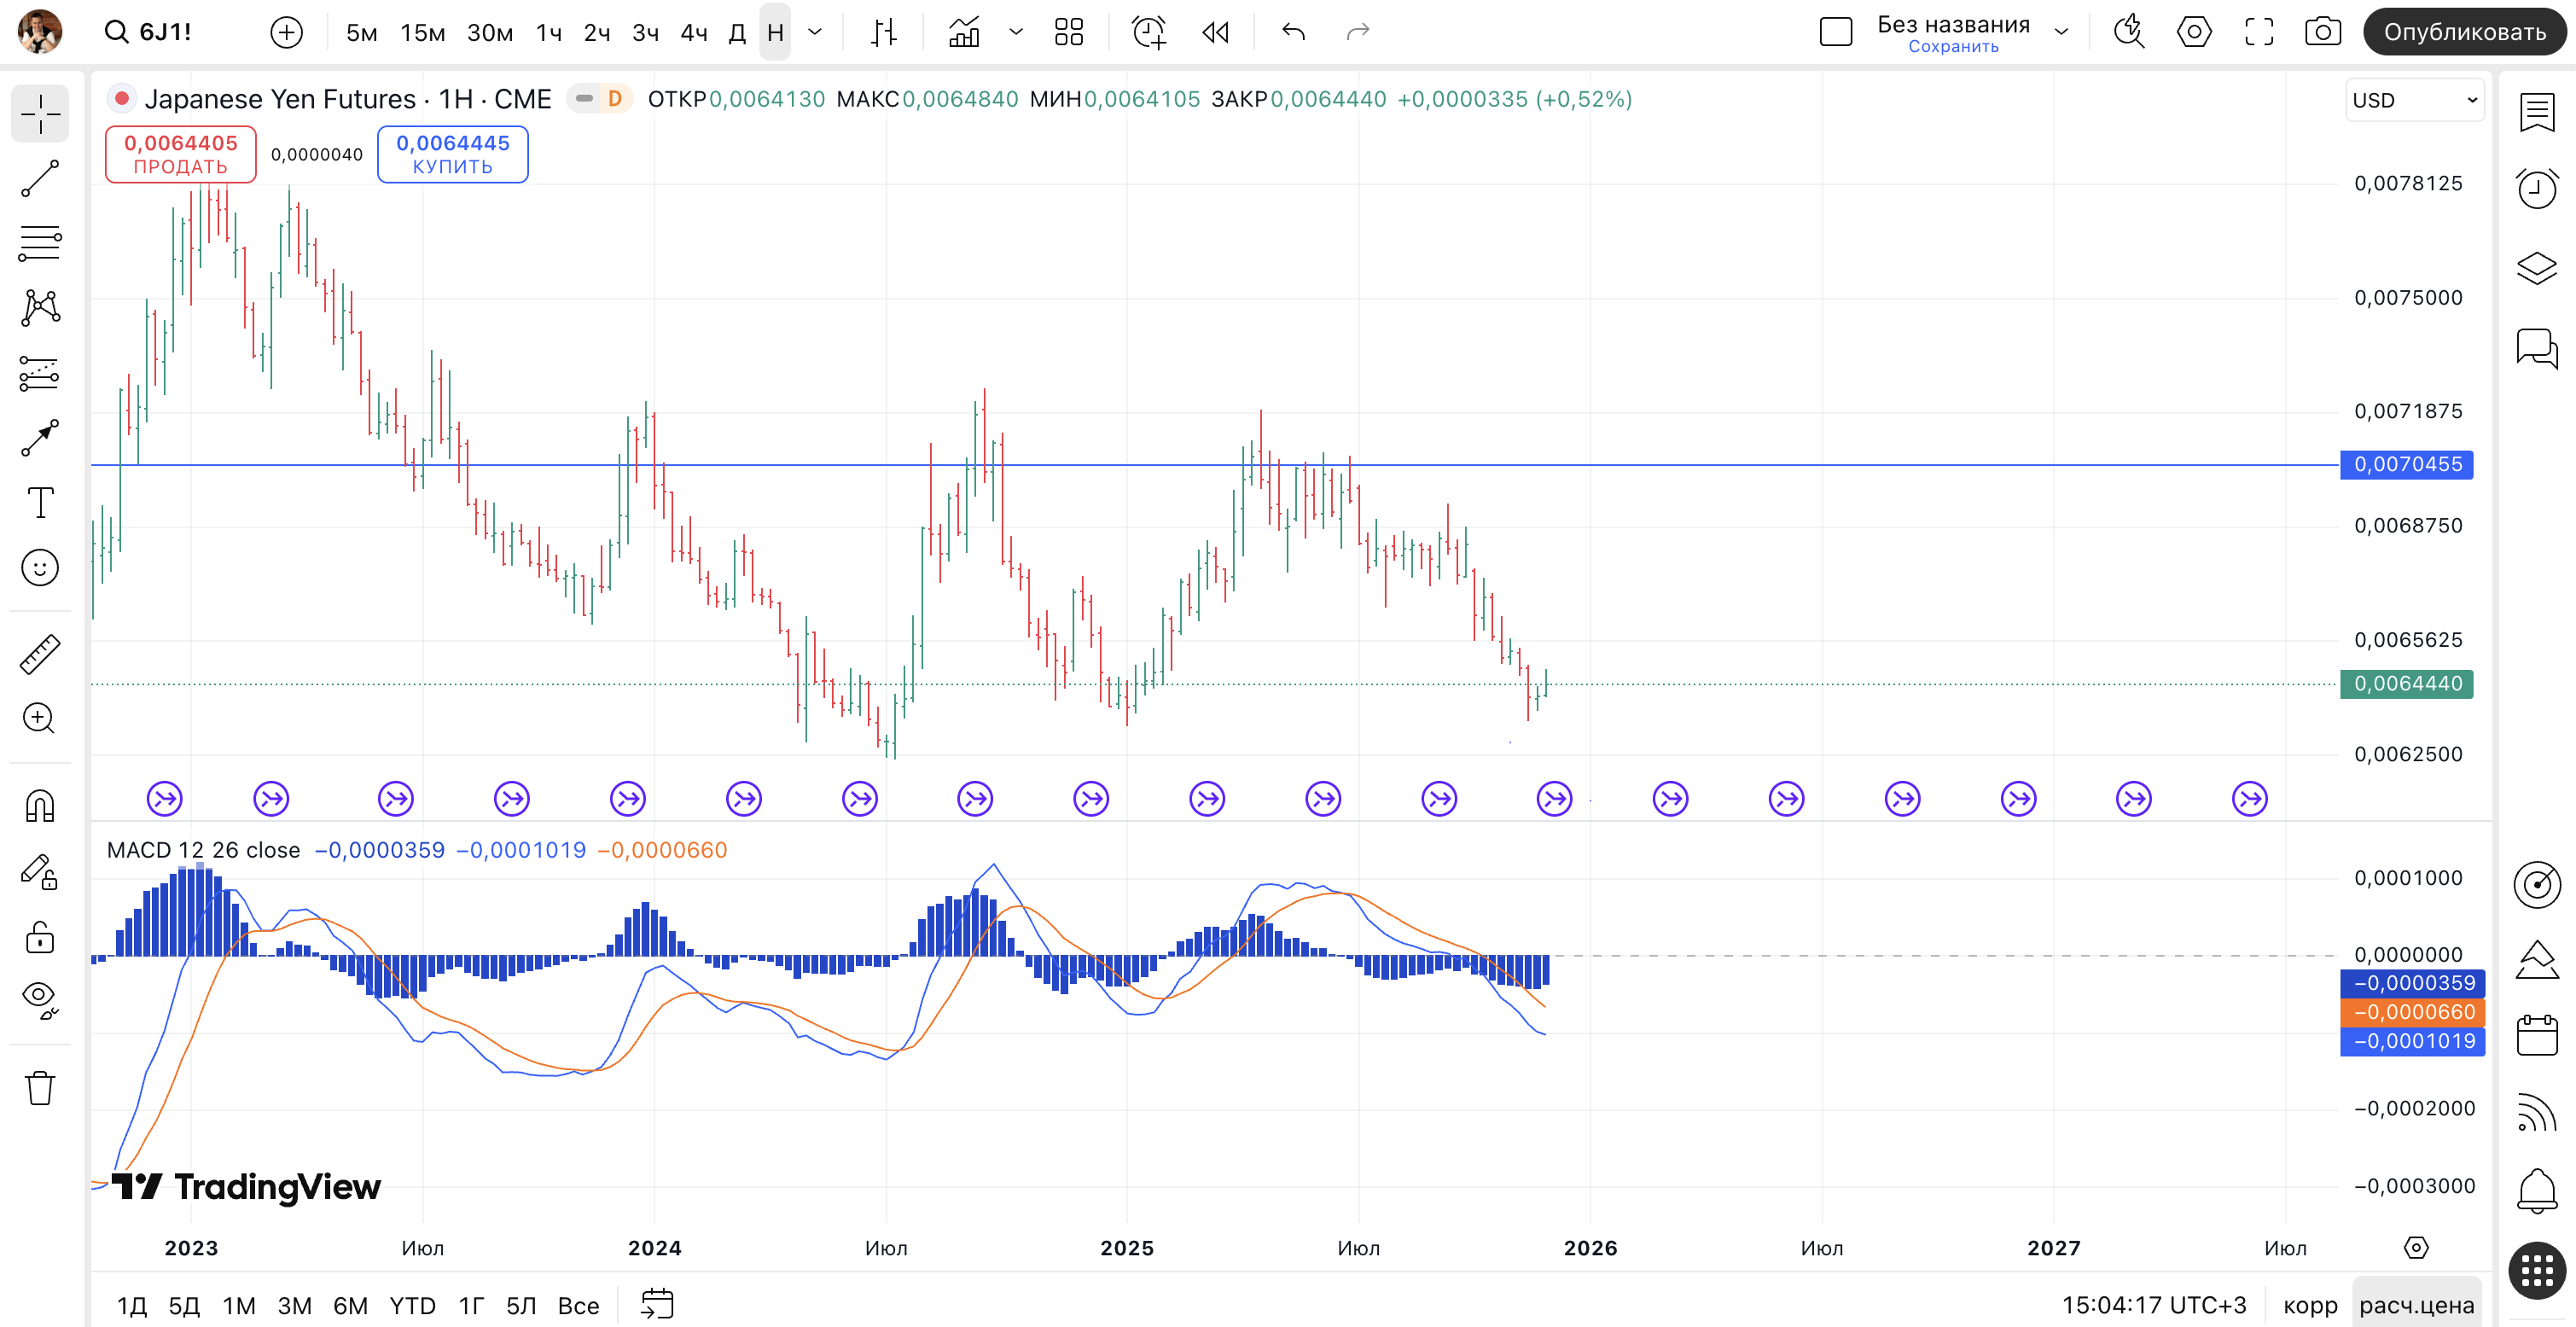
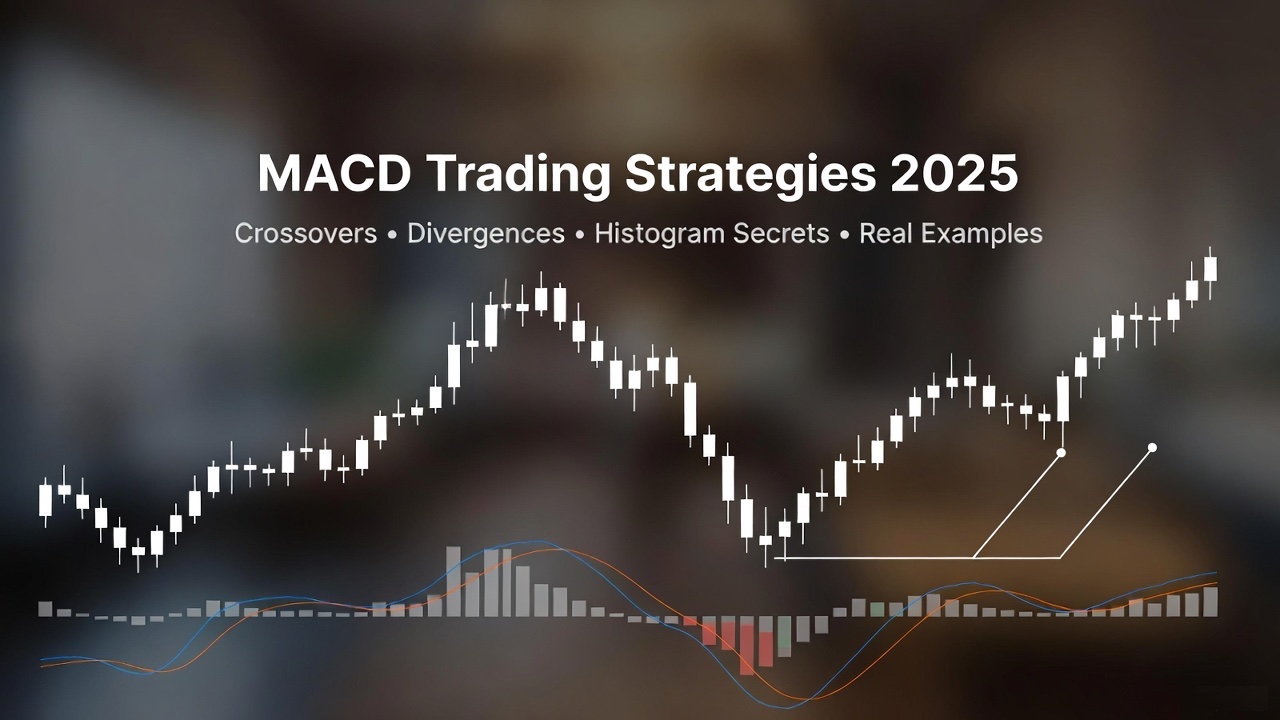
MACD (Moving Average Convergence Divergence) is one of the most popular and versatile technical analysis tools. The indicator was developed by Gerald Appel in 1979 and has since become an essential part of the arsenal for millions of traders worldwide.
The uniqueness of MACD lies in its dual nature: it simultaneously serves as a trend indicator and an oscillator. This allows it to be used both for determining trend direction and strength, and for finding reversal points. Such versatility makes MACD an indispensable tool for various trading styles and is also included in the basics of technical analysis.
Components and MACD Calculation Formula
The MACD indicator consists of three key elements: the MACD line, signal line, and histogram. Understanding each component is critically important for correct signal interpretation and building effective trading strategies.
The MACD line is calculated as the difference between two exponential moving averages: fast (typically 12-period) and slow (26-period). The formula is: MACD = EMA(12) - EMA(26). When the fast average is above the slow one, the MACD line is positive; when below, it's negative.
The signal line is a 9-period exponential moving average of the MACD line. It serves as a trigger for trading signals: crossovers between the MACD line and signal line generate buy or sell signals.
The MACD histogram visualizes the difference between the MACD line and signal line. Positive bars appear when MACD is above the signal line, negative bars when below. Bar height reflects the strength of divergence between the lines.
Standard Settings and Their Adaptation
The classic MACD parameters of 12, 26, 9 were proposed by Gerald Appel and remain optimal for most markets. These values correspond to approximately two weeks, one month, and one and a half weeks of trading respectively, reflecting natural market cycles.
For short-term trading and scalping, traders use accelerated settings: 5, 13, 6 or 8, 17, 9. Such parameters make the indicator more sensitive to price changes, generating more signals. However, the number of false triggers also increases.
For position trading and investing, slowed settings are applied: 19, 39, 9 or 24, 52, 18. These parameters filter market noise and provide more reliable signals on higher timeframes. Trades occur less frequently, but their quality is higher.
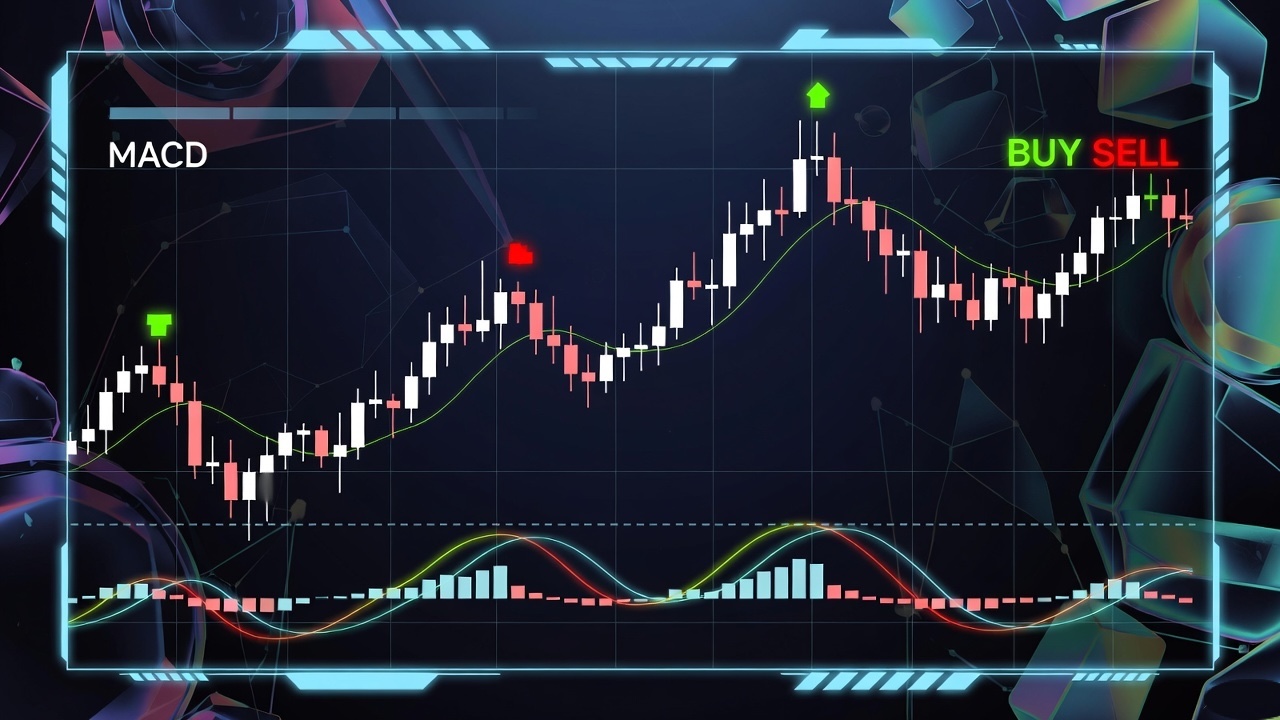
Line Crossovers: The Primary Trading Signal
The crossover between the MACD line and signal line is the basic and most common indicator signal. When the MACD line crosses the signal line from below upward, a bullish buy signal forms. Crossing from above downward generates a bearish sell signal.
Signal strength depends on the crossover position relative to the zero line. A bullish crossover below zero is considered more reliable as it occurs in the oversold zone. Similarly, a bearish crossover above zero has greater significance.
It's important to wait for the candle to close after the crossover to avoid false signals. Within a candle, lines may cross multiple times, and only the close confirms signal validity. Professionals often use additional filters to improve entry quality.
Zero Line and Trend Determination
The zero line separates bullish and bearish territories of the MACD indicator. When the MACD line is above zero, the fast moving average is above the slow one, indicating buyer dominance. Position below zero signals seller control.
The zero line crossover itself is a powerful signal. MACD transitioning from negative to positive territory confirms the beginning of an uptrend. The reverse transition signals a downtrend start. These signals are particularly valuable on daily and weekly charts.
The distance of the MACD line from zero reflects current trend strength. The further the indicator from the zero line, the stronger the divergence between moving averages and the more powerful the momentum. Extreme values often precede corrections or reversals.
MACD Histogram: Momentum Visualization
The MACD histogram is a powerful tool for assessing movement strength and dynamics. Growing bars indicate strengthening momentum in the trend direction. Decreasing bars warn of weakening driving force and possible correction.
Histogram sign change — transition from positive to negative bars or vice versa — occurs at the moment the MACD line crosses the signal line. This visually simplifies trading signal identification without needing to watch the lines themselves.
Special attention deserves divergence between histogram and price. A new price high with a lower histogram peak signals weakening bullish momentum. A similar situation with lows warns of fading bearish pressure.
MACD Divergence: Reversal Signal
Divergence between price and MACD indicator is one of the most reliable technical analysis signals. It occurs when price movement direction diverges from indicator direction, pointing to current trend weakening.
Bullish divergence forms when price creates a new low while MACD shows a higher low. This means that despite continued price decline, bearish momentum is weakening. The signal foreshadows a potential upward reversal.
Bearish divergence occurs with a new price high and a lower MACD high. Bullish momentum loses strength even as price still makes new peaks. This warns of possible downward reversal and signals to close long positions.
Hidden divergences work as trend continuation signals. In an uptrend: price forms a higher low while MACD shows a lower low. This indicates trend strength and opportunity to add to position on pullback.
MACD and Support/Resistance Levels
Combining MACD with support and resistance levels significantly improves trading signal quality. A MACD buy signal near a strong support level has considerably higher success probability.
As price approaches a key level, the trader monitors indicator behavior. A bullish MACD crossover at support confirms a bounce. A bearish crossover at resistance strengthens downward reversal probability.
MACD divergence in a significant level zone is a most powerful signal. Bullish divergence at support creates ideal buying conditions with a close stop-loss. Bearish divergence at resistance forms a point for short position entry.
MACD Across Different Timeframes
Multi-timeframe MACD analysis significantly improves trading effectiveness. The cascade principle: a signal on a lower timeframe has value only when confirmed by direction on a higher one. Weekly MACD determines strategy, daily guides entry tactics.
On weekly charts, MACD crossovers are rare but extremely significant. A bullish crossover on the weekly timeframe can signal the beginning of a multi-month rally. Traders use such signals for forming large positional trades.
The daily timeframe is the primary working tool for most active traders. MACD signals here are sufficiently reliable and occur with acceptable frequency. Hourly and four-hour charts are used to refine entry points and manage positions.
On intraday periods, MACD generates many signals, a significant portion of which are false. Scalpers must filter indicator signals through higher timeframe direction and consider market context.
Trading Strategies Using MACD
Classic crossover strategy: enter long on a bullish MACD crossover below zero, exit on a bearish crossover above zero. Stop-loss is set beyond the nearest local extreme. This strategy works well in trending markets.
Zero line strategy: buy when MACD crosses zero from below upward, sell when crossing from above downward. A more conservative approach with fewer signals but increased reliability. Especially effective on daily and weekly charts.
Divergence strategy: enter after confirmed divergence formation and appearance of a reversal candlestick pattern. Stop-loss beyond the divergence extreme. Take-profit at the nearest significant level or opposite indicator signal.
Histogram strategy: tracking histogram peaks and valleys to determine momentum. Decreasing bars after a peak signal profit-taking. Histogram sign change is a potential point for new entry.
MACD and Volume Analysis
Integrating MACD with volume analysis creates a powerful signal confirmation system. A MACD crossover accompanied by a volume spike has significantly greater reliability than a signal on low volume.
MACD divergence combined with falling volume on the last impulse is the strongest reversal confirmation. The market loses interest in continuing the movement, reflected in price, indicator, and trading volume.
Zero line crossover on rising volume confirms a new trend beginning. Large players are entering the market, and the movement has potential for continuation. Low volume at crossover warns of a possible false breakout.
MACD Combined with Other Indicators
The MACD and RSI combination is a classic pairing of oscillator and trend indicator. RSI determines overbought/oversold zones, MACD confirms direction. Coinciding signals from both indicators significantly increase success probability.
MACD with Bollinger Bands: a MACD buy signal when price touches the lower Bollinger Band creates a high-probability entry point. Selling works similarly when touching the upper band with a bearish MACD signal.
MACD and Fibonacci levels combination: MACD signal at correction levels of 38.2%, 50%, or 61.8% provides entry points in the main trend direction with optimal risk-to-reward ratio.
Common Mistakes When Using MACD
Ignoring market context is the main mistake when working with MACD. The indicator lags by nature, and using its signals without considering market structure, news background, and higher timeframes leads to losses.
Trading against a strong trend based on divergence is a common problem. Divergence can form for an extended time while the trend continues. It's necessary to wait for price reversal confirmation rather than entering prematurely.
Excessive optimization of settings for historical data leads to curve fitting. Parameters that worked perfectly in the past are often useless in the future. Standard settings of 12, 26, 9 have been tested for decades and remain the optimal choice.
Ignoring false signals in sideways markets. MACD is a trend tool, and during consolidation periods generates many losing entries. Recognizing volatile sideways movement is critically important for filtering signals.
MACD in Cryptocurrency Trading
Cryptocurrency markets are characterized by heightened volatility and stronger trends, making MACD an especially useful tool. Impulse movements in cryptocurrencies are well tracked by the indicator's histogram.
For cryptocurrencies, accelerated MACD settings are often applied: 8, 17, 9 or 5, 13, 6. This allows faster reaction to rapid market movements. However, the number of false signals also increases, requiring additional filtering.
MACD divergences on cryptocurrency charts form powerful signals for positional trades. Weekly divergences on Bitcoin have historically preceded major reversals and provided opportunities for long-term position entries.
MACD and Smart Money
In the context of the Smart Money concept, MACD helps identify accumulation and distribution phases. Prolonged indicator presence in the zone near zero with small fluctuations often corresponds to large player activity.
MACD divergence on higher timeframes can signal the completion of institutional distribution or accumulation phases. When Smart Money is ready for reversal, the indicator begins showing divergence from price before the visible reversal occurs.
Sharp MACD exit from the zone near zero with increasing histogram often coincides with the beginning of an impulse phase after accumulation. This is the moment when large capital begins aggressively moving price in the intended direction.
MACD Modifications
Two-color histogram MACD is a popular modification where color changes not at zero crossing, but at histogram direction change. Rising bars are one color, falling bars another. This helps see momentum weakening earlier.
MACD with additional moving averages: some traders add horizontal levels or a histogram moving average to the MACD chart. This creates additional reference points for analysis.
Zero Lag MACD is a modification with reduced lag through special calculation formulas. Signals appear earlier than standard MACD, but sensitivity to noise increases. Used by experienced traders for aggressive trading.
Psychological Aspects of MACD Trading
MACD disciplines traders with clear entry and exit rules. Visually clear signals — line crossovers, histogram sign changes — reduce trading emotionality and help maintain system adherence.
However, the indicator's lagging nature creates psychological tension. Traders see price has already moved part of the way before MACD gave a signal. This provokes premature entries or missing signals due to FOMO .
Patient waiting for confirmed signals and accepting that part of the move will be missed is the key to profitable MACD trading. The indicator doesn't predict the future but confirms an already-started movement.
Backtesting Strategies with MACD
Testing on historical data is a mandatory stage before applying any MACD strategy. The indicator is easily programmable, allowing automated verification of various settings and signal combinations.
When backtesting, it's important to consider commissions, spreads, and realistic execution conditions. Historical results are always more optimistic than live trading. Strategy robustness margin should cover expected performance degradation.
Testing across various market conditions — trending, sideways, volatile — reveals strategy weaknesses. A robust system shows acceptable results in all market regimes, not just favorable ones.
Conclusion
The MACD indicator deservedly holds a place among fundamental technical analysis tools thanks to its versatility and proven effectiveness. The combination of trend-following and oscillator properties makes it applicable in diverse market conditions and on any assets. For advanced understanding, study the trading indicators.
The key to successful MACD use is a comprehensive approach. The indicator isn't designed for isolated application, but combined with level, volume, and market context analysis, it becomes a powerful trader's ally. Understanding the tool's strengths and weaknesses, patiently waiting for quality signals, and strictly following risk management rules transform MACD from a simple indicator into a systematic element of profitable trading. Beginner traders are recommended to master basic signals on a demo account before transitioning to real funds.
Frequently Asked Questions
MACD (Moving Average Convergence Divergence) is a trend-following oscillator showing the relationship between two exponential moving averages. Developed by Gerald Appel in 1979 to determine trend strength and direction.
Classic MACD settings: fast EMA — 12 periods, slow EMA — 26 periods, signal line — 9 periods. These parameters work well for most markets and timeframes.
Main MACD signals: crossover of MACD line and signal line (buy when crossing from below, sell when crossing from above), zero line crossover, divergences between price and indicator.
The MACD histogram displays the difference between the MACD line and signal line. Growing histogram indicates strengthening momentum, declining histogram warns of weakening. Color change signals potential reversal.
MACD is a trend indicator that works better in directional movements. RSI is an oscillator effective in sideways markets. MACD shows trend direction and strength, RSI shows overbought and oversold zones.
About the Author
Author: Igor Arapov — independent researcher in trading psychology and behavioral finance, practising trader since 2013, founder of arapov.trade, author of a trading book series (Open Library ), (ORCID: 0009-0003-0430-778X ).