The RSI (Relative Strength Index) is one of the most popular and versatile technical indicators, developed by American engineer Welles Wilder and introduced in 1978 in his book "New Concepts in Technical Trading Systems." Over nearly half a century, RSI has become an essential tool in the arsenal of millions of traders worldwide and rightfully belongs to the category of technical indicators .
The indicator belongs to the oscillator class — instruments that fluctuate within a defined range. RSI measures the speed and magnitude of price changes on a scale from 0 to 100, helping determine the strength of the current trend and potential reversal points. Unlike trend indicators, RSI is most effective for identifying moments of movement exhaustion.
RSI Calculation Formula
Understanding the mathematics behind the indicator helps interpret its signals correctly. RSI is calculated using the following formula: RSI = 100 - (100 / (1 + RS)), where RS (Relative Strength) is the ratio of average price gains to average losses over the selected period.
The standard calculation period is 14 candles, as recommended by Wilder himself. The calculation considers only candle closes: positive changes are summed separately from negative ones. Average values are updated using exponential smoothing for smoother display.
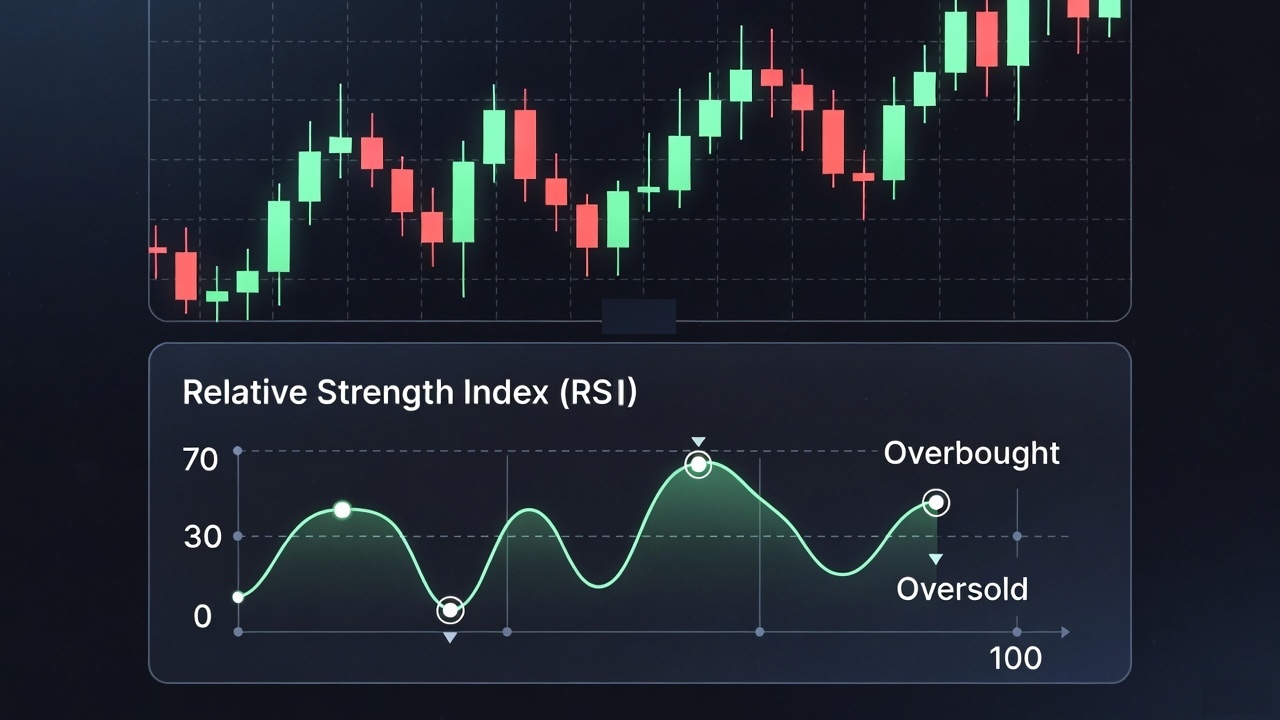
The result always falls within the 0 to 100 range. Values closer to 100 indicate buyer dominance, while values closer to 0 show seller prevalence. The neutral zone lies in the 40-60 area, where supply and demand forces are relatively balanced.
Overbought and Oversold Zones
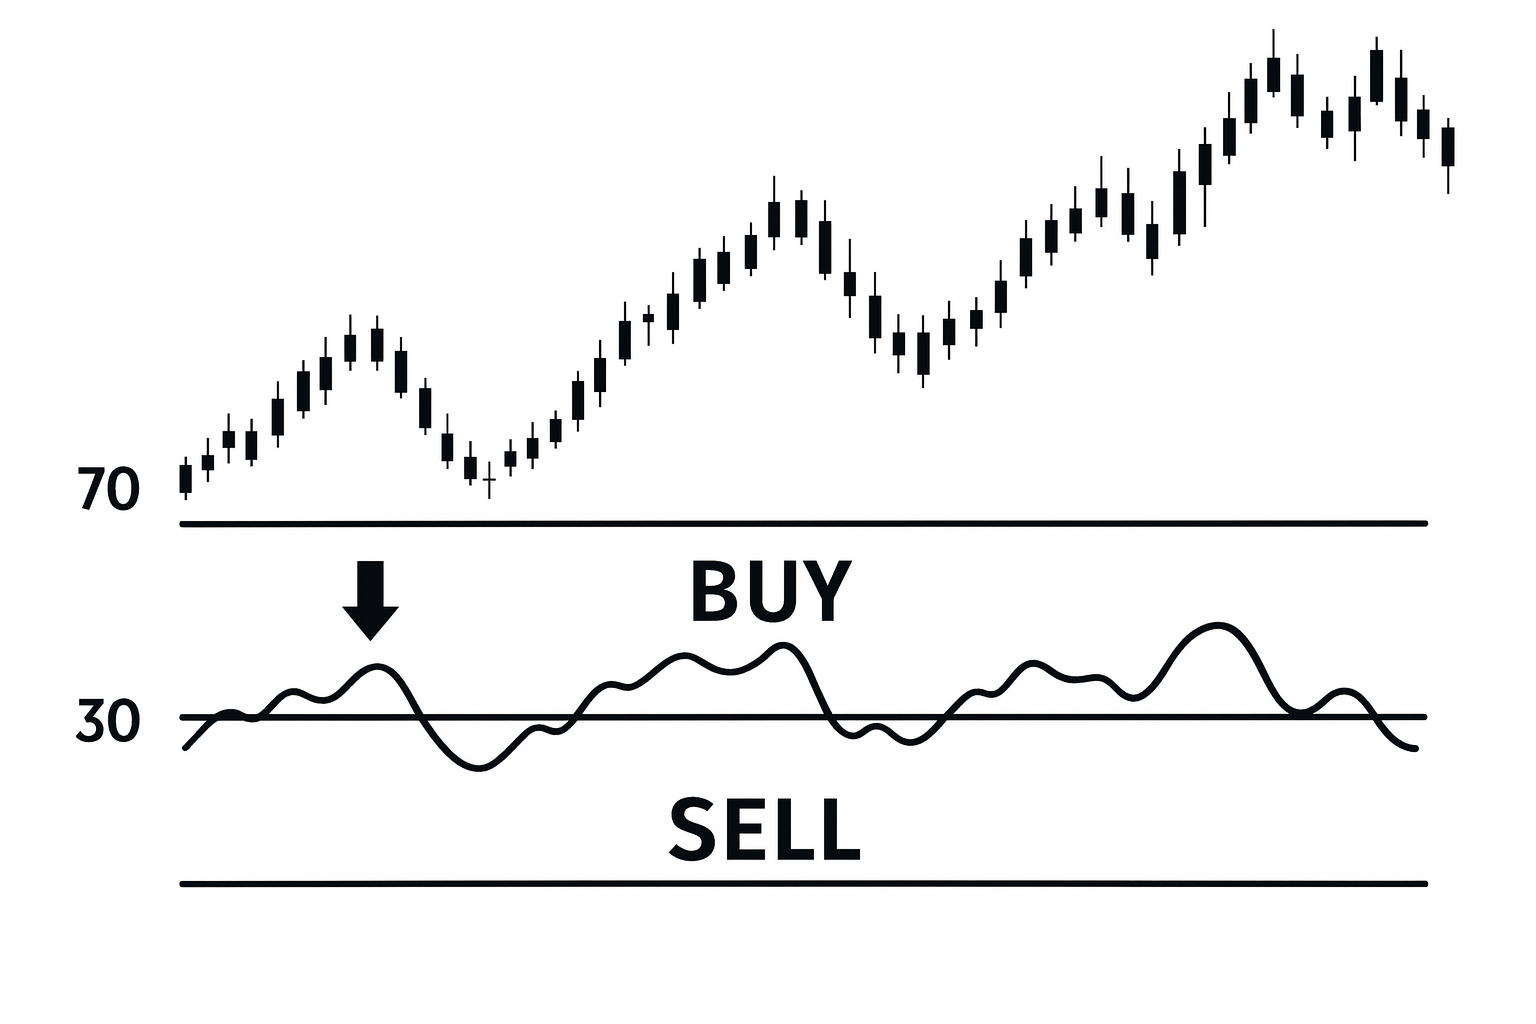
Classic RSI interpretation identifies two extreme zones: overbought (RSI above 70) and oversold (RSI below 30). The indicator entering these areas signals potential exhaustion of the current momentum.
However, it's crucial to understand a key misconception among beginner traders: RSI being in an extreme zone doesn't mean an immediate reversal. In strong trends, the indicator can remain overbought or oversold for weeks while price continues moving. Attempting to trade against the trend based solely on extreme RSI values leads to losses.
The professional approach involves waiting for RSI to exit the extreme zone with confirmation on the price chart. For strong trending markets, traders adjust standard levels: 80/20 for volatile assets or cryptocurrencies, 75/25 for more conservative trading.
RSI Divergence: A Powerful Reversal Signal
Divergence — a discrepancy between price movement direction and the RSI indicator — is considered one of the most reliable signals in technical analysis. It indicates weakening momentum of the current trend and increases the probability of reversal.
Bullish (positive) divergence forms when price makes a new low while RSI shows a higher low. This means seller pressure is weakening despite continued price decline. The signal points to a potential upward reversal.
Bearish (negative) divergence occurs when price reaches a new high while RSI forms a lower high. Buyers are losing strength even though price is still making new peaks. This warns of a possible downward reversal and signals to close long positions.
Hidden divergence works as a trend continuation signal. In an uptrend: price forms a higher low while RSI makes a lower low. In a downtrend: price creates a lower high while RSI makes a higher high. Such signals confirm the strength of the current movement.
RSI Period Settings for Different Trading Styles
RSI period selection significantly affects signal characteristics. The standard period of 14 provides a balance between sensitivity and noise filtering. This is the optimal choice for most situations and is recommended for beginner traders.
Short periods (7-9) increase indicator sensitivity, generating more signals. Suitable for scalping and intraday trading. The disadvantage is an increased number of false triggers. They require mandatory confirmation from other tools.
Long periods (21-25) smooth RSI fluctuations, reducing the number of signals but improving their quality. Used by swing traders and position investors. Divergences on these settings have greater significance for medium-term forecasting.
Centerline and Trend Determination
The centerline at level 50 separates bullish and bearish RSI territory. The indicator consistently staying above 50 confirms an uptrend; below 50 confirms a downtrend. This simple filter helps trade in the direction of the main movement.
Centerline crosses generate trading signals: crossing from below to above 50 is viewed as a bullish sign; from above to below as bearish. Combined with support and resistance level analysis, such crosses help identify optimal entry points.
In sideways markets, the centerline often acts as an RSI oscillation zone. Lack of stable positioning above or below 50 indicates consolidation. In such conditions, it's preferable to trade from range boundaries rather than seeking trend signals.
Failure Swing Pattern
Failure Swing is a specific RSI pattern proposed by Wilder as an independent reversal signal that doesn't require price chart analysis. The pattern forms entirely within the indicator and is considered highly reliable.
Bullish Failure Swing: RSI drops below 30, bounces up, declines again but doesn't reach the previous low or the 30 level, then breaks the local high. This pattern indicates the end of the downward movement and the beginning of recovery.
Bearish Failure Swing: RSI rises above 70, pulls back down, rises again but doesn't reach the previous high or the 70 level, then breaks the local low. A signal of weakening buyers and likely price decline.
RSI Combinations with Other Indicators
RSI is most effective in combination with other types of tools. Pairing with trend indicators — moving averages or MACD — allows trading pullbacks in the direction of the main trend.
Integration with volume analysis strengthens signal reliability. RSI divergence accompanied by falling volume on the last impulse is powerful reversal confirmation. A volume spike when exiting an extreme zone indicates the start of a new movement.
RSI combined with Fibonacci levels helps find entry points on corrections. The coincidence of an oversold RSI zone with a 61.8% retracement level creates a high-probability buying area in an uptrend.
Common Mistakes When Using RSI
The main mistake is blindly following overbought/oversold signals without considering market context. In trending markets, price can ignore extreme RSI values. Attempting to catch tops and bottoms using only the oscillator leads to a series of losing trades.
Ignoring timeframe is a common problem. An RSI signal on a minute chart has minimal significance compared to a daily one. Professionals use multi-timeframe analysis: they look for signal alignment on higher and working timeframes.
Lack of confirmation from price action reduces trading effectiveness. RSI is an auxiliary tool, not a self-sufficient system. Candlestick patterns, level breakouts, and volume reactions should confirm indicator signals to improve win rate.
RSI Across Different Timeframes
Multi-timeframe RSI analysis significantly improves trading decision quality. The principle is simple: a signal on a lower timeframe has value only if confirmed by direction on a higher one. Weekly RSI determines strategic direction; daily RSI guides tactical entries.
On weekly charts, RSI divergences form powerful signals preceding trend reversals lasting months. Patient position traders use precisely these setups for large positions. Lower timeframe noise doesn't affect the significance of such signals.
Daily RSI serves as the main working tool for most active traders. Sufficient signal significance combines with acceptable opportunity frequency. Hourly and four-hour RSI are used to refine entry points and manage positions.
Intraday periods require caution. RSI on minute charts generates numerous false signals due to market noise. Scalpers working with minute RSI must filter signals through higher timeframe structure and volume analysis.
RSI in Sideways Markets
Sideways markets are the natural habitat of oscillators, including RSI. In consolidation conditions, the indicator works most effectively, accurately identifying range boundaries and optimal moments for entry from extremes.
The range trading strategy uses levels 30 and 70 as signals. When RSI reaches level 30 and turns up, a long position opens with a target at the upper range boundary. Stop-loss is placed below the local consolidation minimum.
When RSI reaches level 70 and turns down, a short position opens with a target at the lower boundary. The risk-to-reward ratio in a properly identified range typically equals 1:2 or better, ensuring positive mathematical expectation.
It's critically important to recognize the transition from sideways movement to trend. RSI breaking above 70 and holding in the overbought zone signals the start of an uptrend. Falling below 30 with consolidation indicates a downtrend. At this point, the range strategy should be discontinued.
RSI in Cryptocurrency Trading
The cryptocurrency market is characterized by heightened volatility , affecting RSI application. Standard 70/30 levels are too sensitive — on Bitcoin, the indicator regularly reaches 85-90 in bullish phases or 10-15 in bearish ones without immediate reversal.
For cryptocurrencies, extended zones of 80/20 or even 85/15 are recommended. This reduces false signals in extreme movement conditions. Divergences on daily and weekly crypto asset charts provide quality signals for position trading and timely profit-taking.
The 24/7 crypto market operation requires adapting settings and approaches. Some traders use period 10 to account for continuous trading specifics. Integrating RSI with on-chain data analysis and market sentiment creates a comprehensive decision-making system for working with digital assets.
Practical Examples of RSI Trading
Let's examine a typical bullish divergence entry scenario. Price forms a new low, but RSI shows a higher low in the oversold zone below 30. The trader waits for RSI to exit above 30 and a bullish candle to form. Entry is executed on the confirming candle's close.
Stop-loss is set below the local minimum with a buffer for volatility. The first target is the nearest resistance level or previous accumulation zone. Upon reaching the target, part of the position is closed; the remainder moves to breakeven to capture potential continuation.
Trend scenario: in a sustained upward movement, RSI corrects to the 40-45 level without entering the oversold zone. This is a healthy pullback preserving the indicator's bullish structure. Entering on an RSI bounce from this zone allows joining the trend with optimal risk-to-reward ratio.
RSI Trading Strategies
Counter-trend strategy uses extreme RSI values for entry against the current movement. Conditions: RSI drops below 30 (or rises above 70), then returns to the normal zone with confirmation. Entry is executed on signal line breakout or appearance of a reversal candlestick pattern.
Trend strategy applies RSI for finding entry points in the direction of the main market movement. In an uptrend, buys are made when RSI bounces from the 40-50 level upward after correction. In a downtrend, sells occur on a pullback to the 50-60 zone and indicator turn downward.
Divergence strategy focuses on discrepancies between price and indicator. Entry after formation of confirmed divergence and appearance of a reversal candlestick pattern. Stop-loss is set beyond the extreme; take-profit at the nearest significant level in the opposite direction.
RSI and Smart Money
In the context of the Smart Money concept, RSI helps identify accumulation and distribution phases of large players. Extreme indicator values often coincide with institutional activity as they build or close large positions.
Prolonged RSI presence in the oversold zone on higher timeframes may indicate hidden accumulation. Large players accumulate the asset while retail traders panic sell. The end of this phase is often accompanied by a sharp RSI exit from the extreme zone and the start of an impulse move.
RSI divergences on daily and weekly charts often precede trend reversals organized by Smart Money. Careful observation of discrepancies combined with volume analysis, technical analysis and price behavior at key levels helps anticipate large capital actions.
RSI Modifications
Stochastic RSI is a derivative indicator applying the stochastic formula to RSI values. The result is a more sensitive oscillator responding faster to market dynamics changes. Used by traders who find standard RSI too slow.
Connors RSI is a modification combining classic RSI with two additional components: RSI of price change over the period and percentile rank of movement duration. Creator Larry Connors claims improved oversold signal accuracy.
RSI with dynamic levels adapts overbought and oversold zones to current volatility. During high volatility periods, levels expand; in calm periods, they narrow. This automatically adjusts indicator sensitivity to market conditions.
Psychological Aspects of RSI Trading
RSI helps objectify trading decisions, reducing emotional influence. Clear levels and mathematically defined signals counteract impulsive entries based on fear or greed. The indicator disciplines the trader within system boundaries.
However, there's a danger of mechanically following signals without understanding context. A trader blindly buying every time RSI drops below 30 will face a series of losses in a downtrend. Conscious application is more important than the mere fact of using the indicator.
FOMO — fear of missing out — often forces entry without waiting for RSI signal confirmation. Disciplined waiting for the indicator to exit the extreme zone with additional confirmation reduces false triggers.
Backtesting Strategies with RSI
Strategy testing on historical data is critically important before applying real money. RSI is easily programmable, allowing verification of different settings and combinations on large data sets.
When backtesting, commissions, slippage, and realistic execution conditions must be considered. Results on historical data are always more optimistic than live trading. Strategy robustness margin should exceed expected performance degradation.
Over-optimization is a typical trap when testing RSI strategies. Perfectly fitted parameters for historical data don't work in the future. A robust strategy shows stable results with various settings within a defined range.
Conclusion
The RSI indicator remains one of the fundamental tools of technical analysis thanks to its versatility, ease of interpretation, and decades-proven effectiveness. Proper understanding of its signals — overbought, oversold, divergences, and patterns — significantly improves trading decision quality across all markets and timeframes.
The key to successful RSI use is a comprehensive approach. The indicator isn't designed for isolated application, but combined with trend, level, and volume analysis, it becomes a powerful trader's ally. Adapting settings to specific assets and trading styles, patiently waiting for quality signals, and disciplined risk management transform RSI from a simple oscillator into a systematic element of profitable trading. Beginner traders are recommended to master basic concepts on a demo account before transitioning to real funds.
Frequently Asked Questions
RSI (Relative Strength Index) is a technical oscillator measuring the speed and magnitude of price changes on a scale from 0 to 100. Developed by Welles Wilder in 1978 to identify overbought and oversold conditions.
Classic levels: RSI above 70 signals overbought conditions (potential decline), RSI below 30 indicates oversold (potential rise). In strong trends, levels of 80/20 are used.
Divergence is a discrepancy between price direction and the RSI indicator. Bullish divergence (price falling, RSI rising) foreshadows an upward reversal. Bearish divergence (price rising, RSI falling) signals a potential decline.
The standard period is 14. For short-term trading, use 7-9; for long-term, 21-25. A shorter period gives more signals but increases false positives.
Not recommended. RSI is more effective combined with other tools: support/resistance levels, volume analysis, Price Action patterns. A comprehensive approach improves entry accuracy.
About the Author
Author: Igor Arapov — independent researcher in trading psychology and behavioral finance, practising trader since 2013, founder of arapov.trade, author of a trading book series (Open Library ), (ORCID: 0009-0003-0430-778X ).