The Stochastic Oscillator ranks among technical analysis's most versatile momentum indicators. Developed by George Lane in the 1950s, it measures where current price closes relative to recent trading range. This positioning reveals momentum conditions and potential reversal zones applicable across all tradeable markets.
Unlike trend-following indicators, Stochastic excels at identifying exhaustion points within moves. Its bounded nature between zero and one hundred provides clear reference levels for decision-making. Understanding proper application separates profitable use from common frustrations of false signals. To understand this topic more deeply, I recommend studying Indicators in Trading.
Calculation Fundamentals
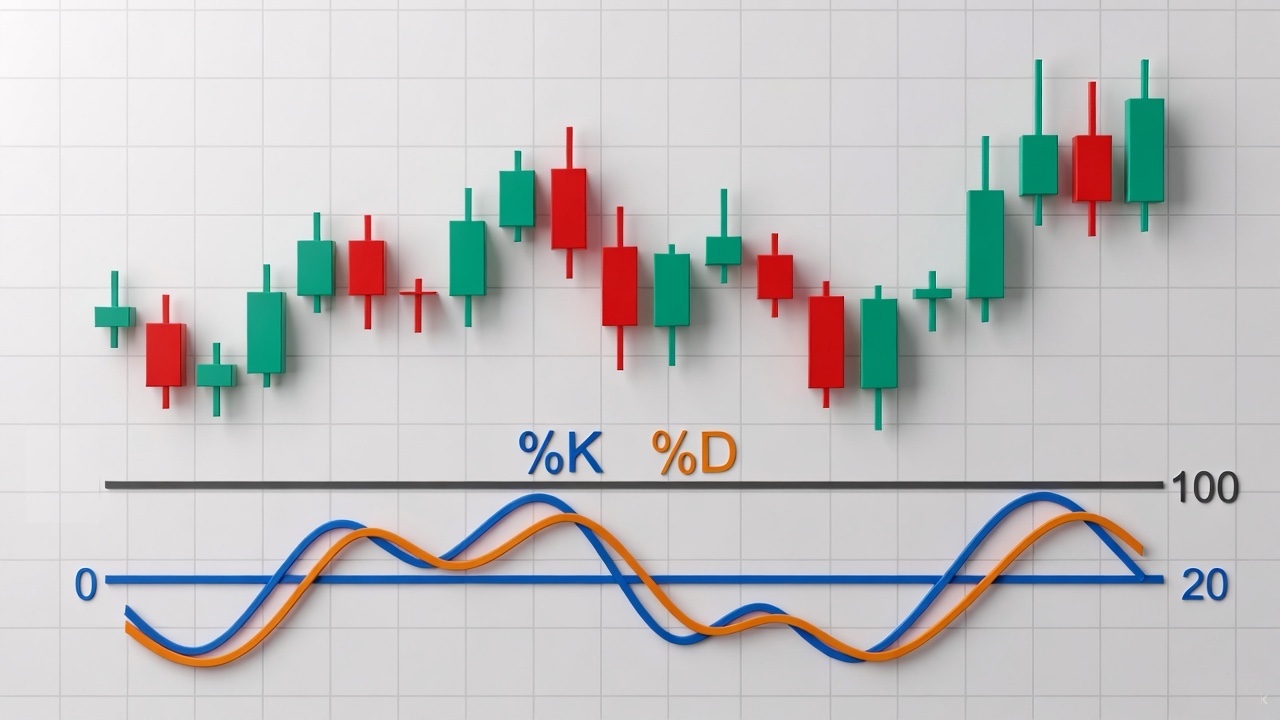
The %K line forms the indicator's core: (Current Close - Lowest Low) / (Highest High - Lowest Low) times 100. This positions current price within recent range as percentage. Close near range high produces high readings; close near low produces low readings.
The %D line smooths %K through simple moving average, typically three periods. This signal line reduces noise and generates crossover signals. The interaction between lines provides timing confirmation.
Fast Stochastic uses raw %K. Slow Stochastic applies additional smoothing. Most traders prefer slow version for reduced whipsaws.
Overbought and Oversold Zones
Overbought conditions register when Stochastic exceeds 80. This indicates price closing near recent highs, suggesting extended positioning. While reversal potential increases, strong trends maintain overbought readings for extended periods.
Oversold conditions appear below 20. Price closing near recent lows suggests potential exhaustion of selling. Downtrends can sustain oversold readings, making trend context essential.
Key insight: overbought and oversold don't automatically mean reversal. In uptrends, oversold readings offer buying opportunities. In downtrends, overbought provides selling opportunities. Trading against trend using these zones produces consistent losses.
Crossover Signals
Crossover between %K and %D provides timing signals. Bullish crossover occurs when %K crosses above %D, particularly valuable in oversold territory. This confirms momentum shift from down to up.
Bearish crossover sees %K dropping below %D, most significant in overbought territory. Quality of crossover matters — clean, angular crossovers indicate decisive momentum changes. Tangled crossovers suggest indecision.
Divergence Trading
Divergence between price and Stochastic provides powerful reversal warnings. Bullish divergence forms when price makes lower low but Stochastic makes higher low. This suggests weakening downside momentum.
Bearish divergence appears when price makes higher high but Stochastic makes lower high. Upside momentum weakens even as price extends. Hidden divergence confirms trend continuation rather than reversal.
Parameter Settings
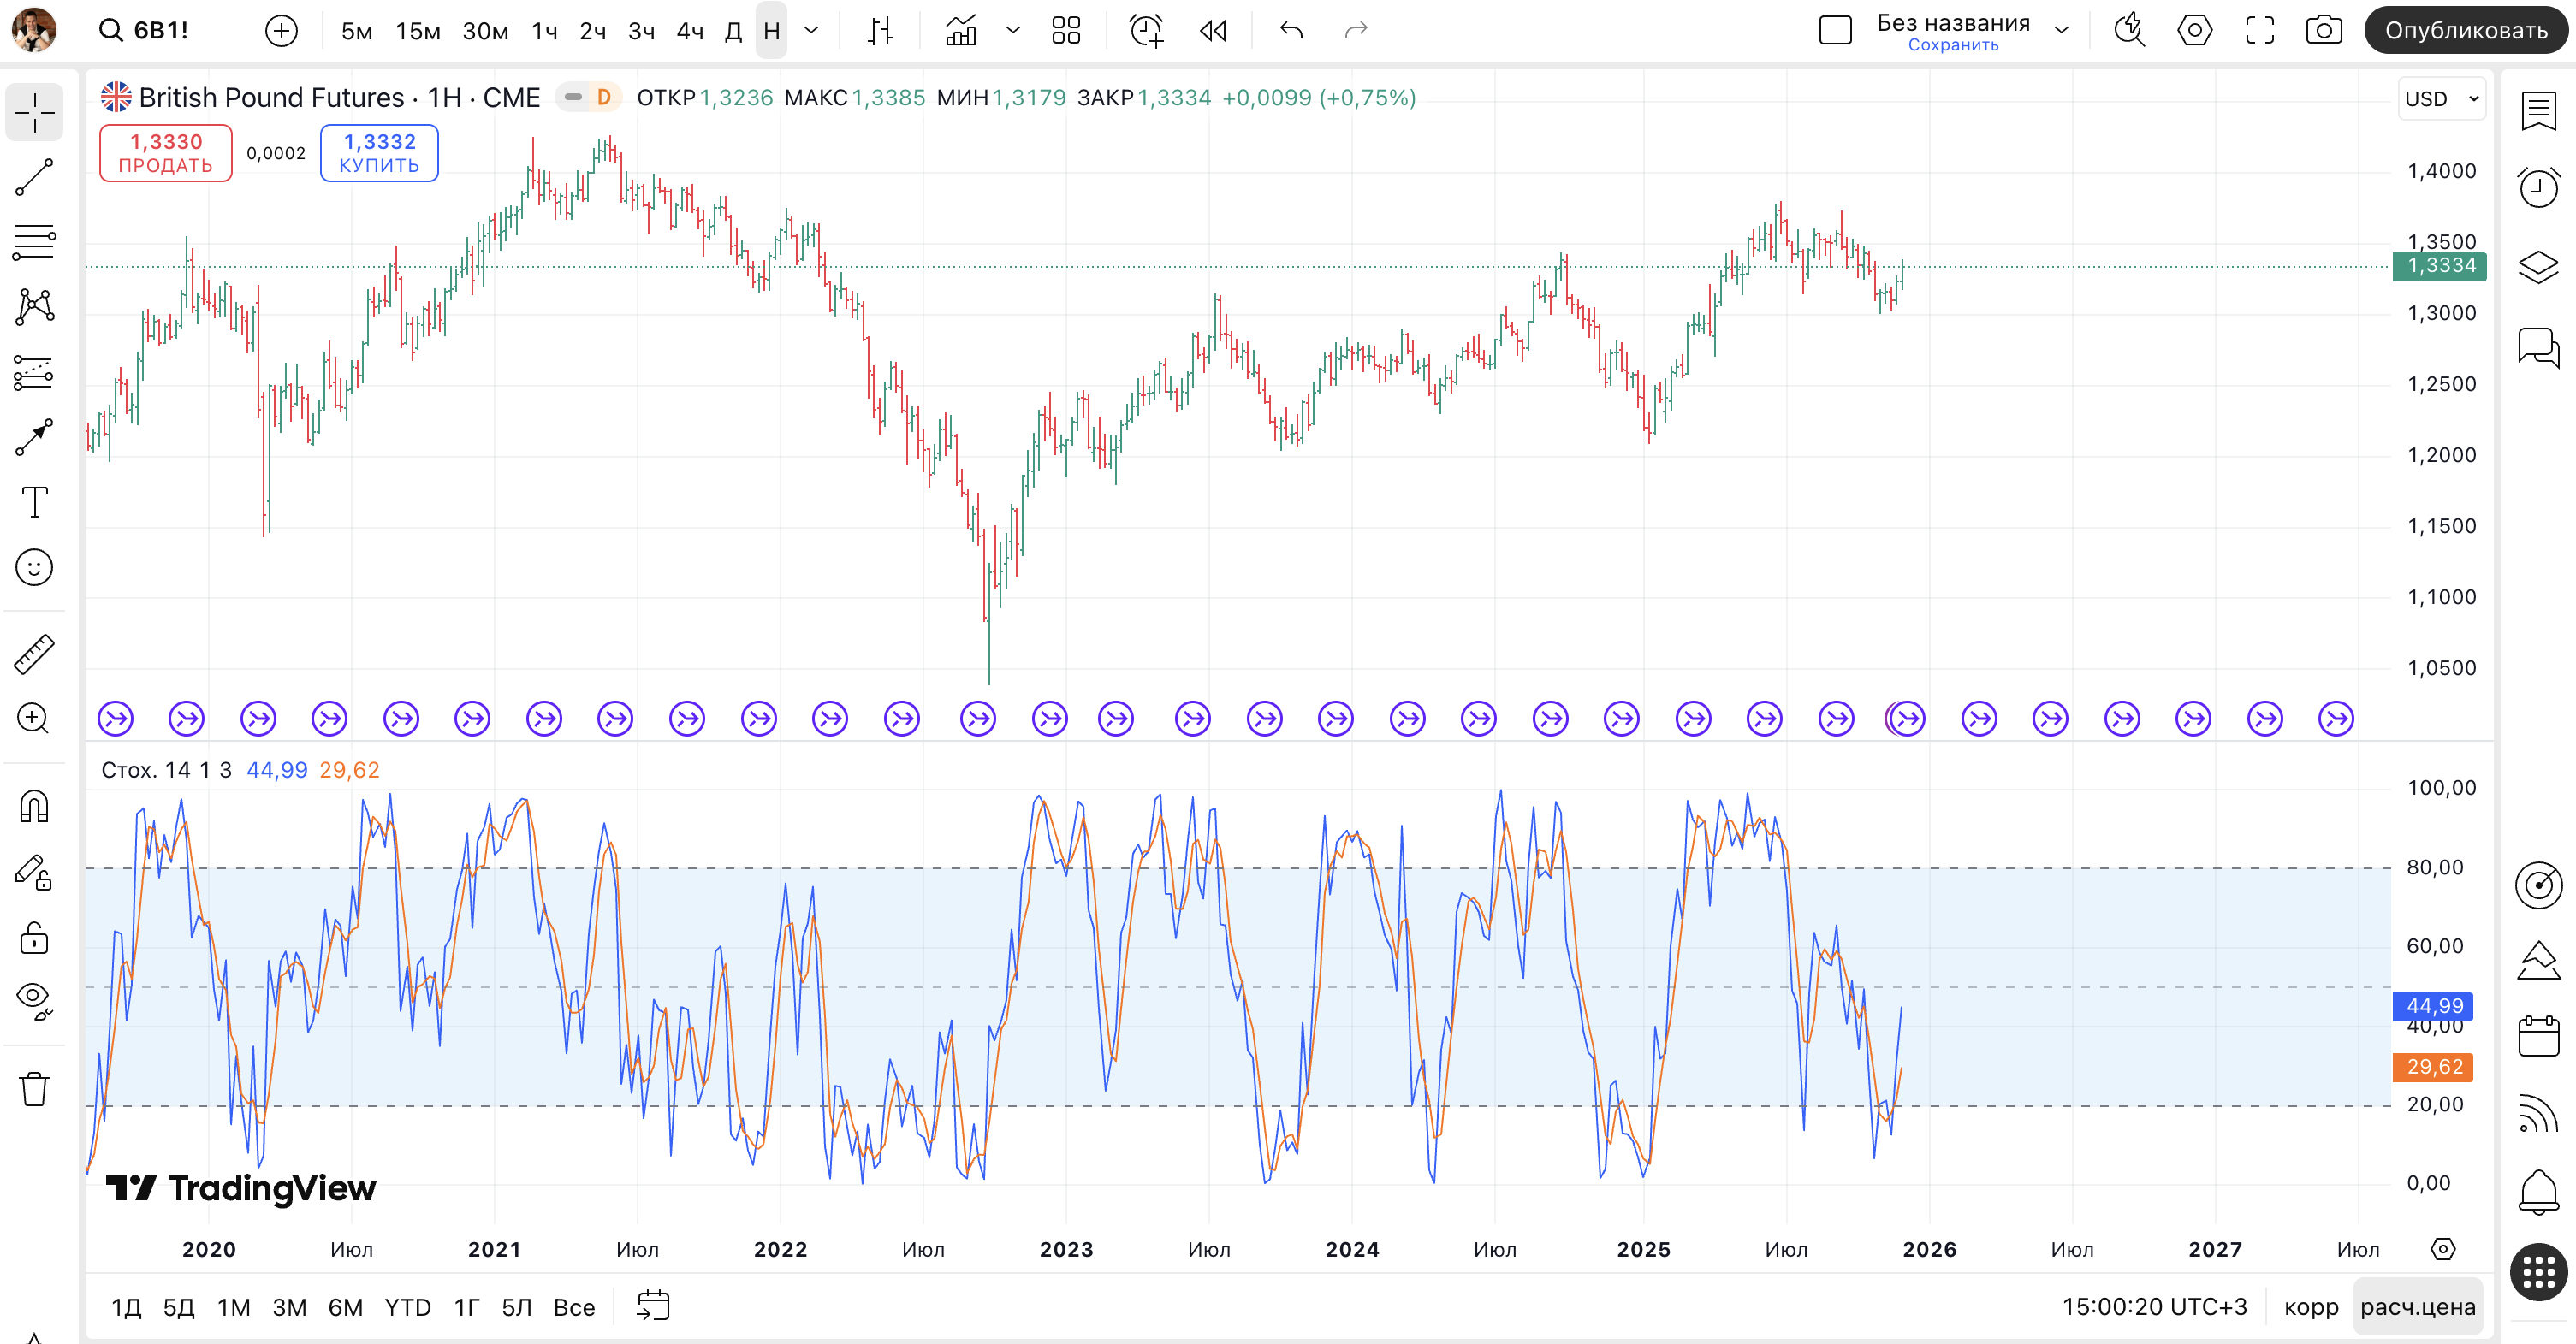
Standard 14,3,3 settings work reliably across most markets and timeframes. This balanced approach captures meaningful momentum shifts while filtering minor fluctuations. Before changing, thoroughly understand default behavior.
Shorter parameters like 5,3,3 increase sensitivity for day trading. More signals generate but also more false ones. Longer parameters like 21,5,5 suit swing trading with smoother curves and fewer whipsaws.
Adjusting overbought/oversold thresholds to 70/30 reduces signals but improves quality. Extreme readings of 90/10 identify only strongest conditions. Backtesting validates parameter changes.
Trend Filter Integration
Combining Stochastic with trend identification dramatically improves results. Moving averages establish directional bias. In uptrends defined by rising 50-day average, only take bullish Stochastic signals. Ignore overbought as sell signal in strong uptrends.
Downtrends flip the approach. Oversold readings become warnings rather than buy signals. Overbought conditions offer short entry opportunities. This alignment with trend direction prevents fighting prevailing momentum. I also recommend studying MACD Indicator for the complete picture.
Higher timeframe context adds confirmation layer. Daily Stochastic oversold with weekly in uptrend provides strong buying setup. Conflicting signals across timeframes suggest reduced conviction.
Multiple Timeframe Analysis
Aligning Stochastic signals across timeframes increases reliability. When daily and weekly both show oversold with bullish divergence, probability of reversal increases substantially. Single timeframe signals carry less weight.
Lower timeframe Stochastic provides entry timing for higher timeframe signals. Weekly signals direction, daily refines timing, hourly pinpoints entry. This cascading approach optimizes risk-reward.
Common Mistakes
Mechanical overbought selling and oversold buying ignores trend context. This approach produces consistent losses in trending markets. Always filter signals through trend analysis before acting.
Ignoring divergence misses valuable reversal warnings. Divergence provides early warning that momentum weakens. Waiting for confirmation improves divergence trading success.
Overtrading on every signal depletes capital. Quality over quantity applies particularly to oscillator signals. Selectivity based on confluence with other factors improves results.
Practical Application
For trend trading, wait for oversold reading in confirmed uptrend. When %K crosses above %D from below 20, enter long with stop below recent swing low. Target previous swing high or resistance.
For reversal trading, require divergence plus overbought/oversold extreme plus crossover. This triple confirmation reduces false signals. Reversals against strong trends still carry elevated risk.
Combining with support/resistance adds context. Stochastic oversold at major support level provides stronger signal than oscillator alone. Price structure and momentum together improve probability assessment.
Limitations
Stochastic remains momentum indicator, not crystal ball. False signals occur regularly, particularly in choppy conditions. No indicator eliminates uncertainty; risk management remains essential.
Strong trends render overbought/oversold zones less useful. Trending markets stay extreme longer than accounts survive fighting them. Adapting approach to market conditions acknowledges this limitation. To consolidate the material, also you should understand RSI Indicator.
Lagging nature means signals come after momentum shift begins. Fastest entries use leading signals confirmed by Stochastic. Waiting for oscillator confirmation improves reliability at cost of timing.
Frequently Asked Questions
Stochastic measures current price relative to high-low range. Values 0-100 indicate momentum and potential reversals.
Above 80 is overbought, below 20 is oversold. These suggest potential reversals but trends can sustain extremes.
Divergence when price makes new high/low but Stochastic does not confirm, signaling potential reversal.
Standard 14,3,3 works across timeframes. Shorter 5,3,3 for day trading. Longer 21,5,5 for swing trading.
Use trend filters. Take oversold signals in uptrends, overbought in downtrends. Combine with support/resistance.
About the Author
Author: Igor Arapov — independent researcher in trading psychology and behavioral finance, practising trader since 2013, founder of arapov.trade, author of a trading book series (Open Library ), (ORCID: 0009-0003-0430-778X ).