Understanding TradingView Platform
TradingView represents a cloud-based platform for technical analysis, charting, and trading idea exchange among traders worldwide. The service combines professional analytical tools with social features, creating a unique ecosystem for financial market participants. To gain a deeper understanding of this topic, I recommend studying this introduction to trading.
The platform provides access to data from over one hundred thousand trading instruments. American and European exchange stocks, forex currency pairs, cryptocurrencies, futures, and commodities become available for analysis within a unified interface. Quotes arrive from leading data providers in real-time mode.
The primary advantage lies in free basic access to most features. Users can build charts, apply indicators, create watchlists, and publish trading ideas without financial costs. Paid tiers expand capabilities for professional usage and active trading requirements.
The interface remains accessible through web browsers, mobile applications for iOS and Android, plus desktop versions. Synchronization between devices ensures work continuity regardless of equipment used for market analysis.
Platform History and Evolution
The project launched in 2011 with an idea to create an open platform where charts combine with social features. Founders aimed to unite professional terminal capabilities with web service accessibility for broader trader audiences.
During initial years, the platform attracted forex traders with basic charting features and classical indicator sets. In 2014, Pine Script emerged as a proprietary programming language for creating custom indicators, substantially expanding service capabilities and user creativity.
The period from 2015 to 2018 marked broker integration, screener additions, and economic calendar implementation. Cryptocurrency exchange support attracted new audiences during the digital asset boom period, significantly growing the user base.
Currently, the audience exceeds fifty million active monthly users. The platform continues evolving, implementing artificial intelligence tools for trading idea analysis and continuous user experience enhancement.
Interface Structure and Core Elements
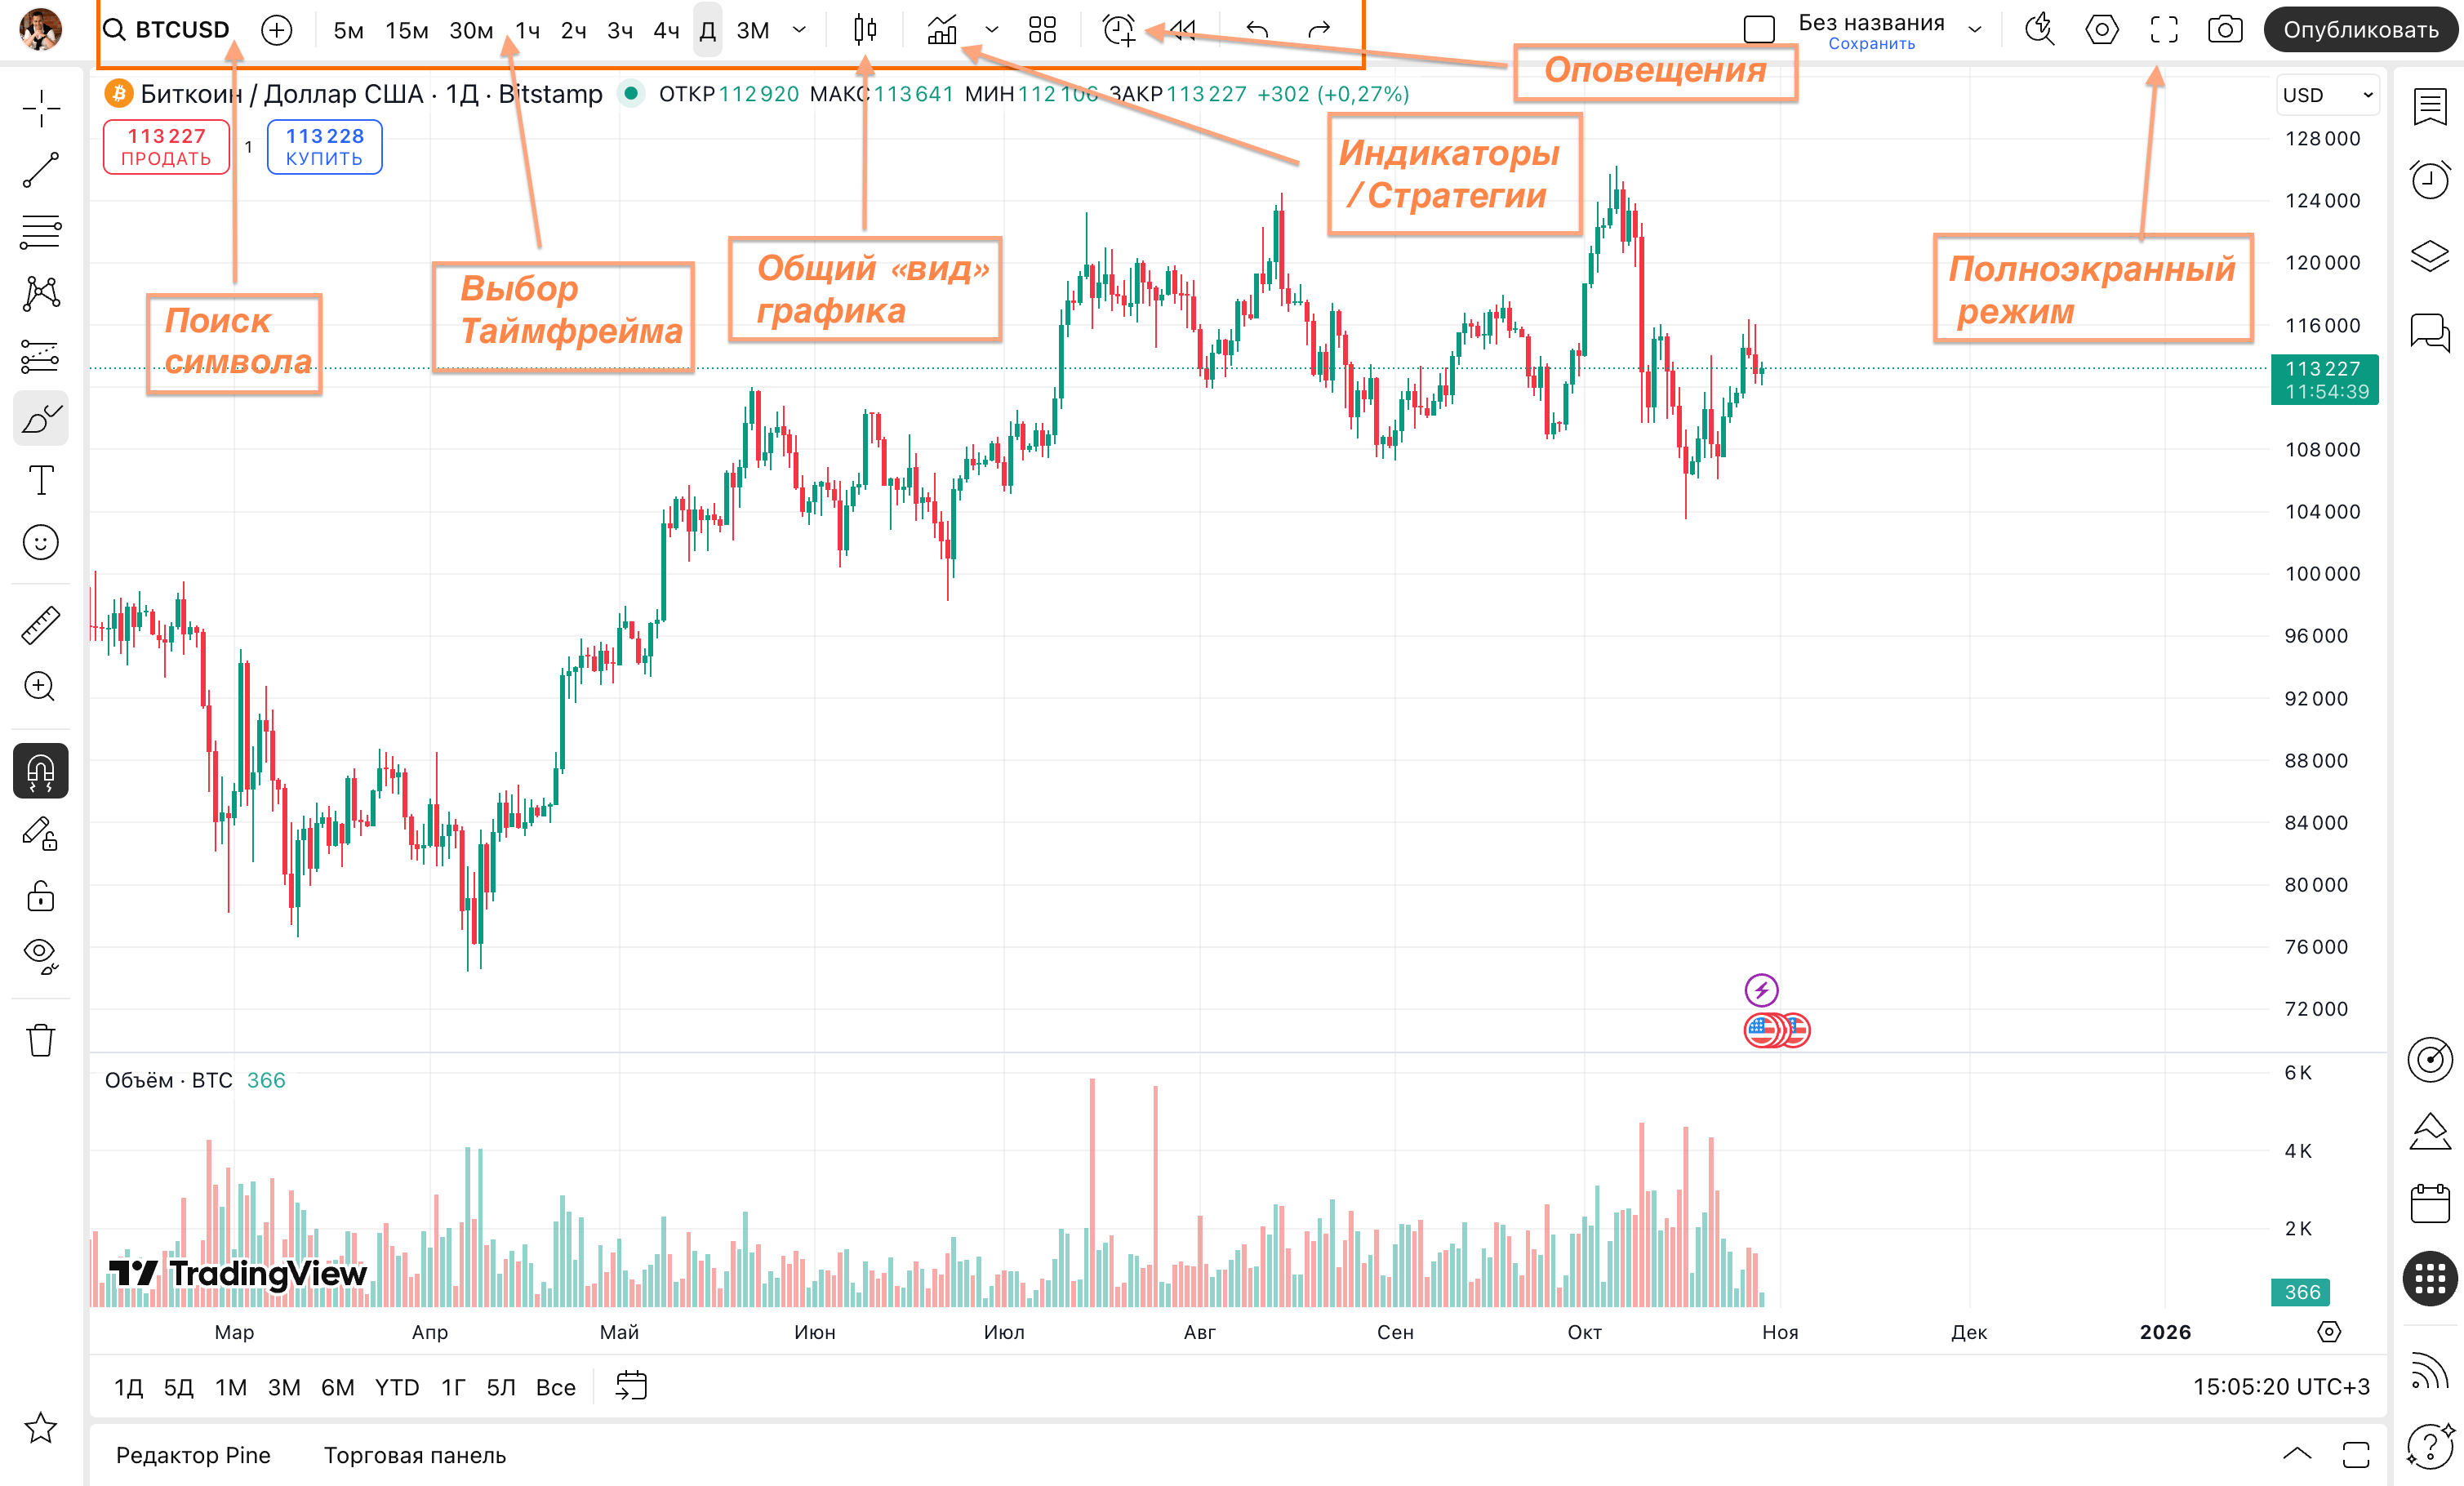
The interface organizes around a central chart area with functional panels along the perimeter. The top toolbar contains instrument search, timeframe selection, buttons for adding indicators, and alert configuration options for price monitoring.
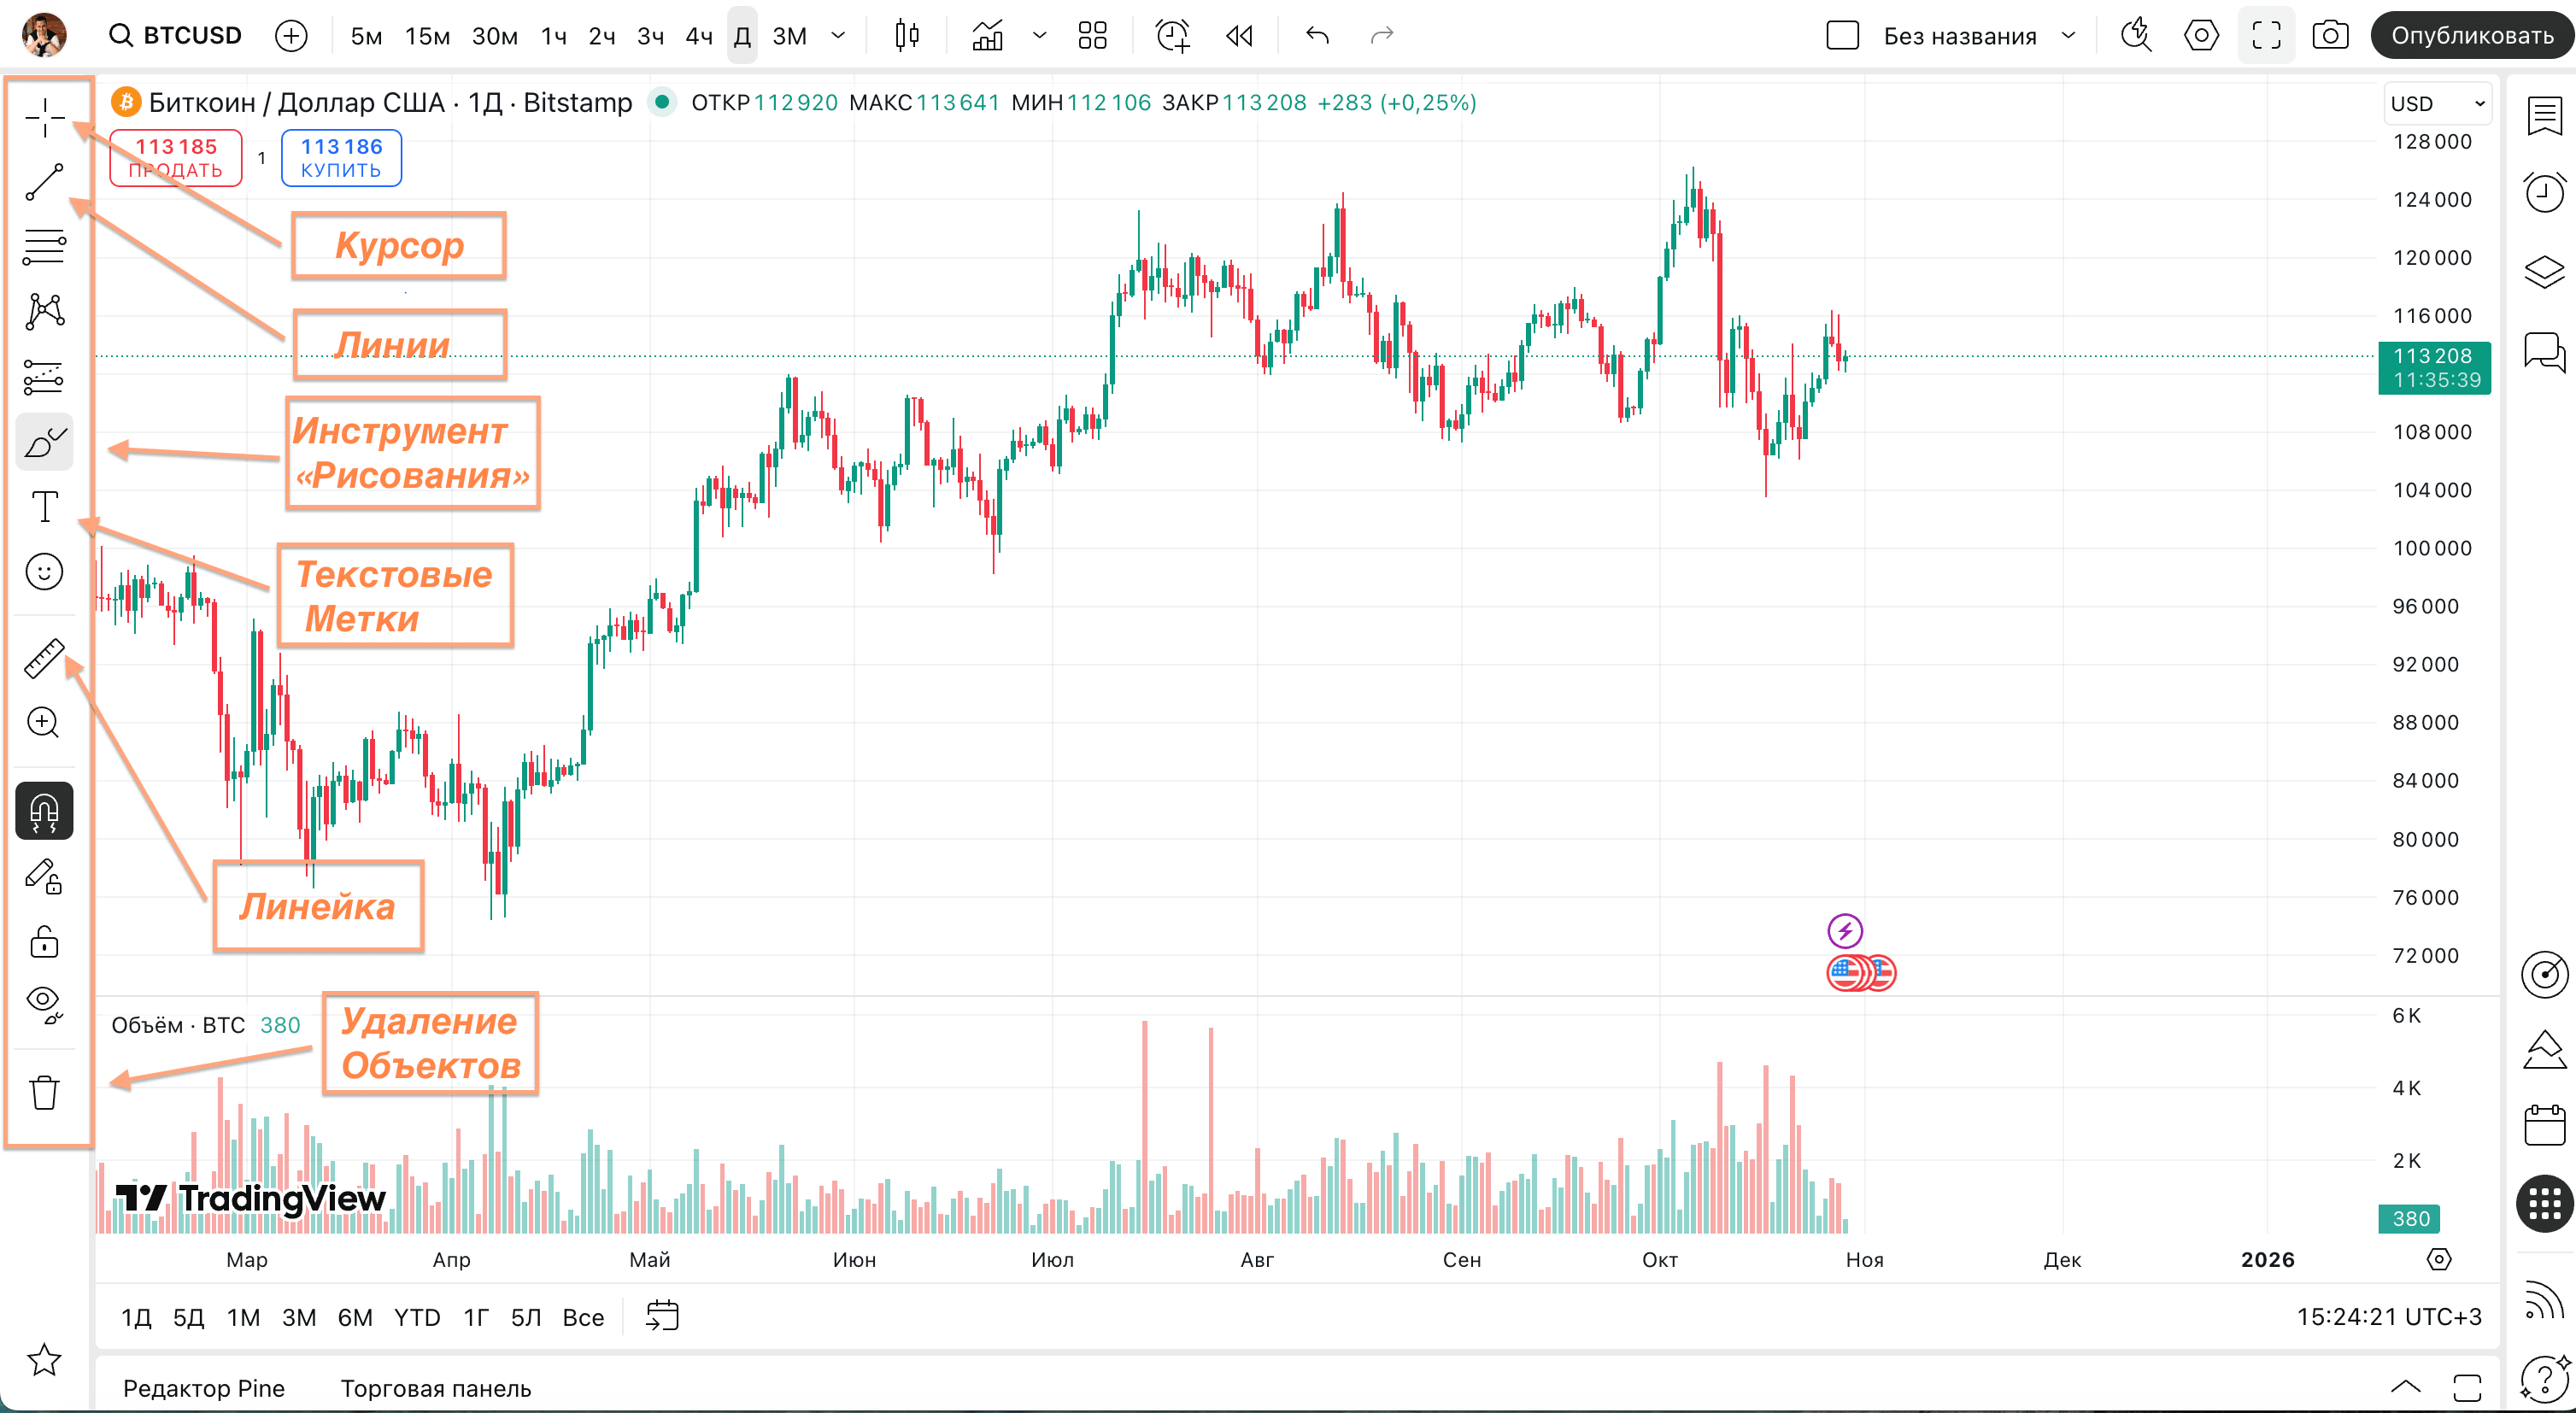
The left vertical panel provides access to drawing tools. Over one hundred elements include trend lines, channels, Fibonacci levels, patterns, and text labels. Magnet functionality automatically snaps objects to candle price values for precision.
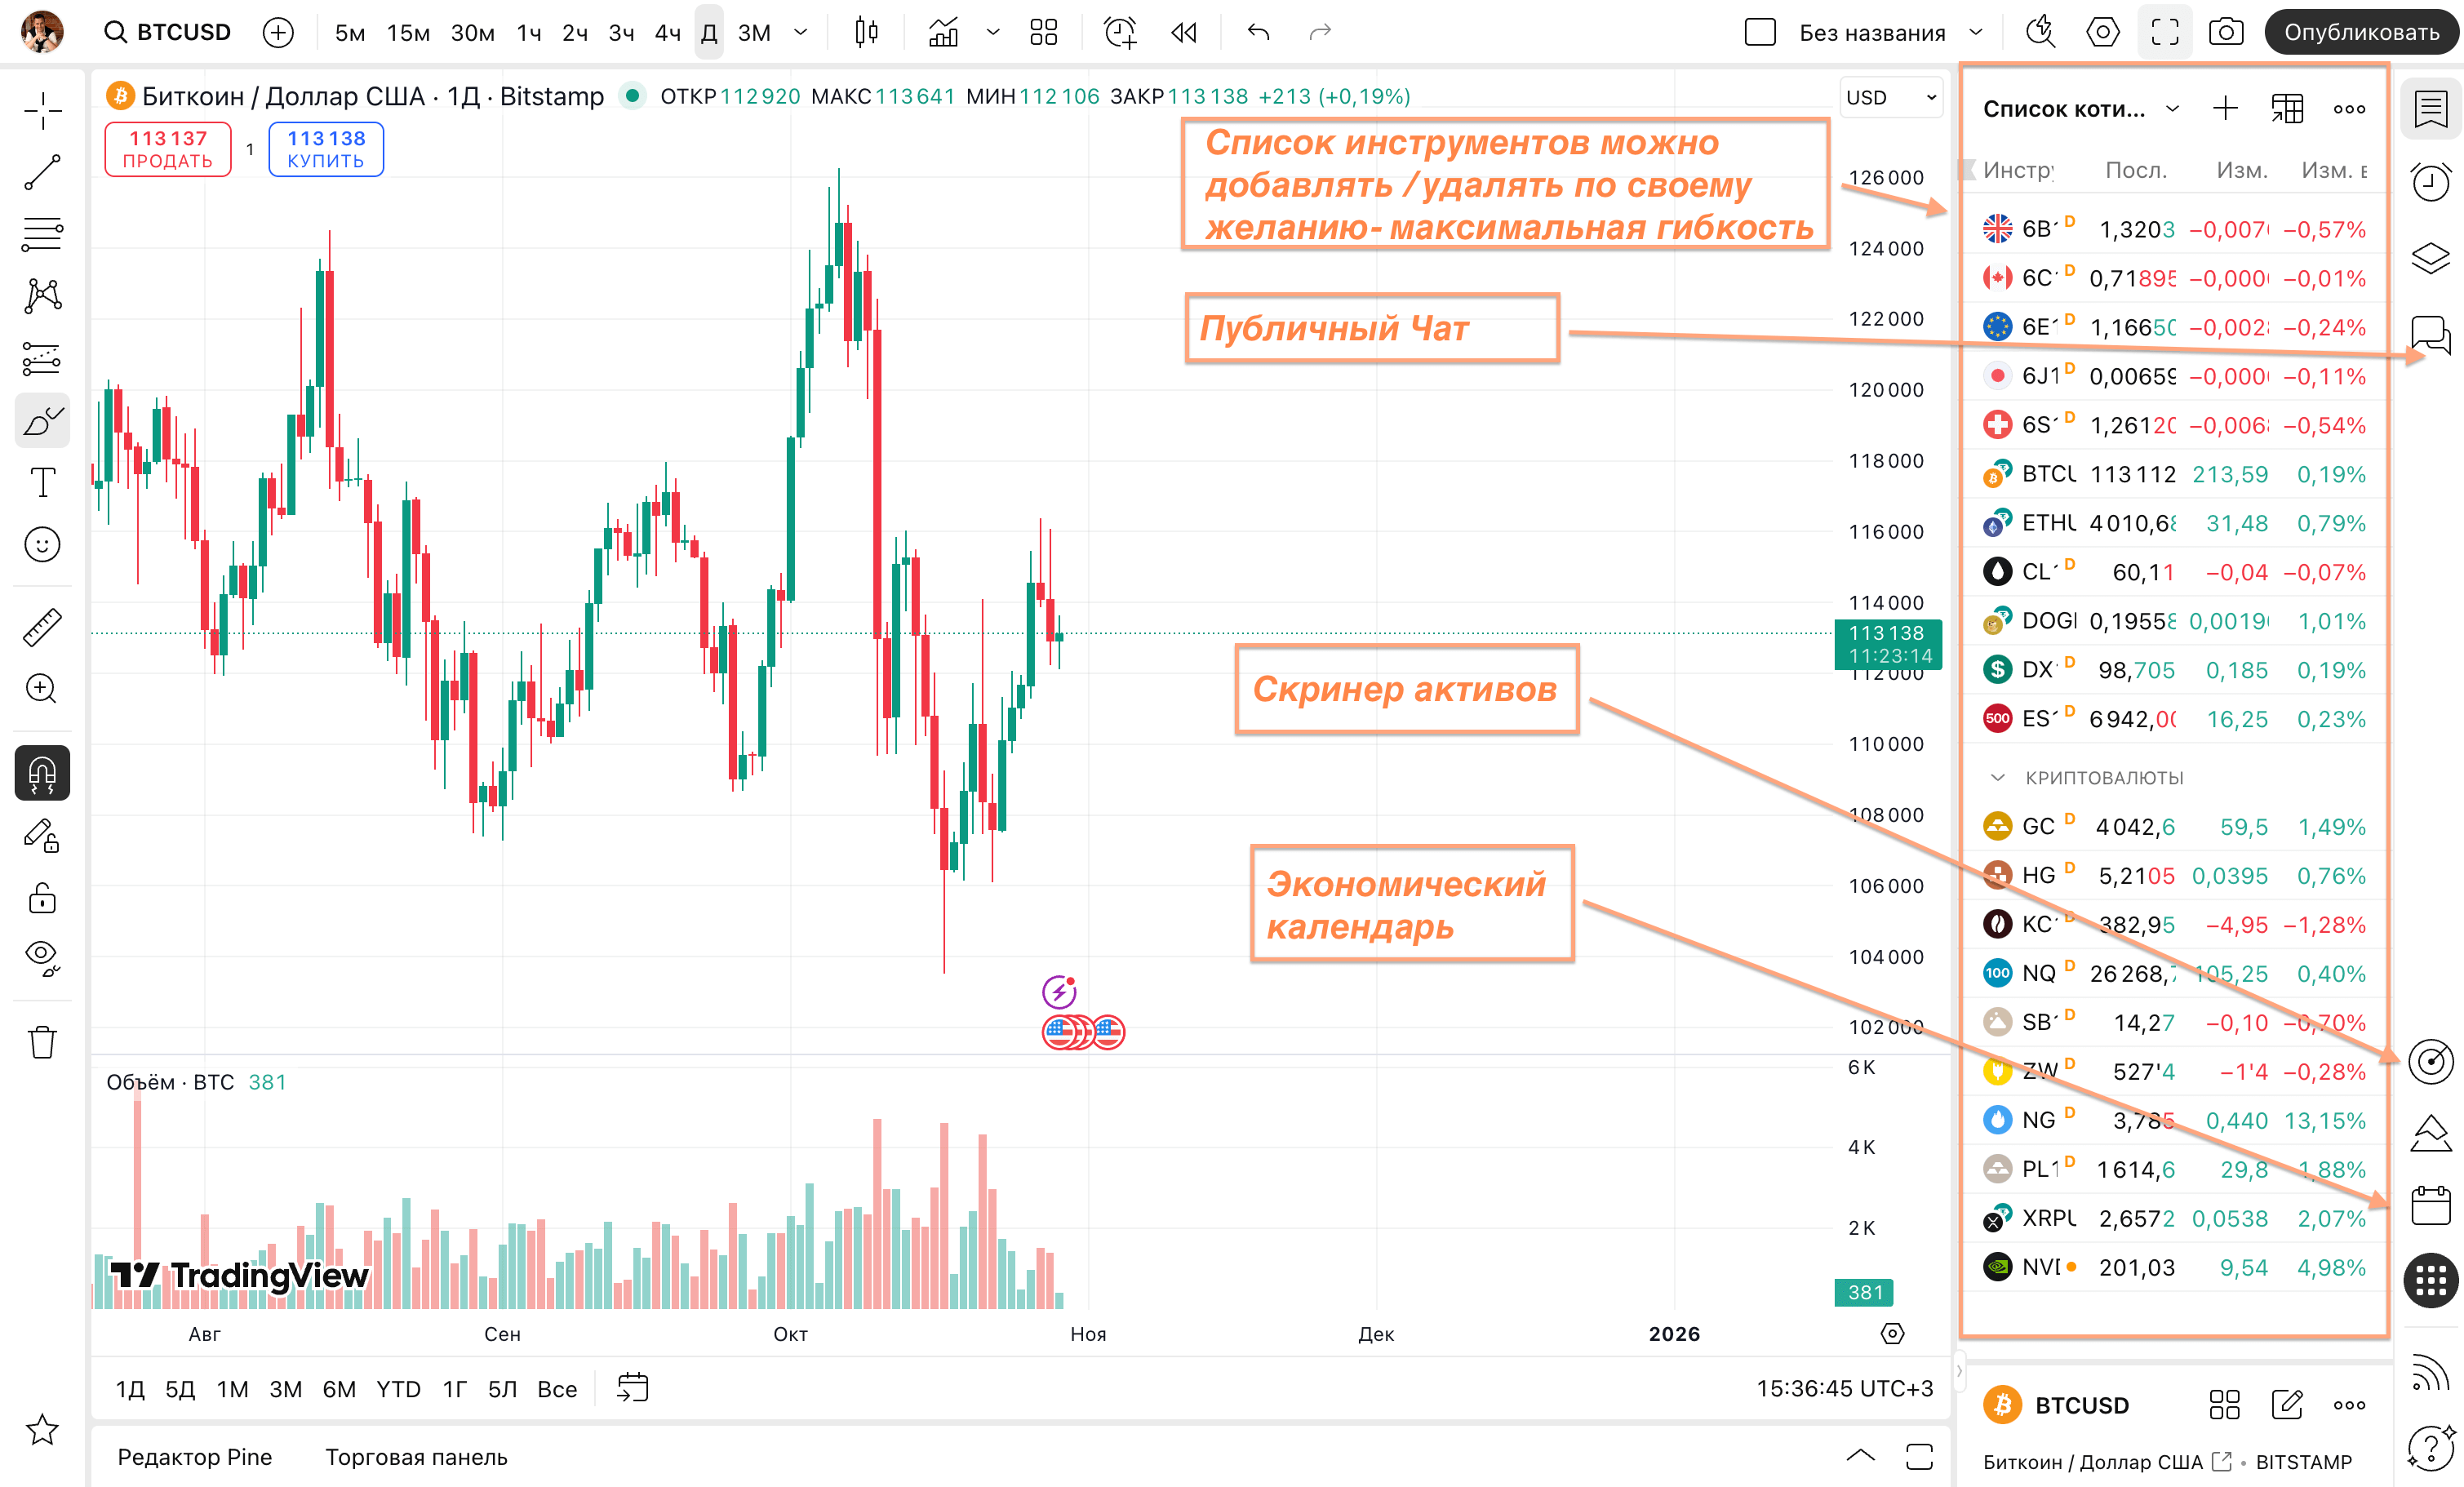
The right sidebar combines watchlist, economic calendar, news feed, and social features. Quick switching between tracked assets accelerates multiple market analysis processes for active traders.

The central area displays the selected instrument chart. Various visualization types remain available: Japanese candlesticks, bars, lines, Heikin Ashi, Renko, and others. Scale settings allow switching between linear and logarithmic display modes.
Technical Analysis Tools Arsenal
The built-in indicator library contains over one hundred analytical tools. Classical oscillators RSI, MACD, and Stochastic complement trend indicators EMA, SMA, and Bollinger Bands. Volume tools including Volume Profile and VWAP reveal market participant activity patterns.
The community library contains over one hundred fifty thousand scripts created by users globally. Search by rating and categories simplifies finding suitable indicators for specific strategies. Each script remains available for source code study and modification.
Drawing tools cover all graphical analysis needs comprehensively. Fibonacci levels include retracement, extension, time zones, and arcs. Gann tools feature fan, square, and grid options. Pattern templates automatically mark typical formations on charts.
Asset comparison function enables overlaying multiple instrument charts for correlation analysis. Comparing Bitcoin with stock indices or currency pairs with commodities reveals important relationships between different markets.
Pine Script Programming Language
Pine Script represents the platform's proprietary programming language for creating indicators and trading strategies. Syntax development considered technical analysis specifics and remains accessible for traders without deep programming knowledge.
Language capabilities include custom indicator creation with chart visualization. Calculation functions enable implementing any mathematical formula for price data analysis. Conditional operators provide flexible signal triggering logic for strategy development.
The strategy module automates trading system testing on historical data efficiently. Backtesting generates reports with profitability, drawdown, and Sharpe ratio metrics. Results visualize directly on charts for easy interpretation.
Alert functionality enables notification configuration when script conditions trigger. Integration with external services through webhook opens trading automation possibilities via third-party applications and trading bots.
Screeners and Asset Filtering
Stock screeners allow filtering thousands of instruments by technical and fundamental criteria. Parameters include P/E ratio, dividend yield, trading volume, and indicator signals. Results sort by selected metrics for easy comparison.
Cryptocurrency screeners cover assets from leading exchanges comprehensively. Filtering by price change, volume, and technical signals identifies promising trading instruments. Exchange integration ensures data relevance and accuracy.
Forex screeners analyze currency pairs by volatility, trend strength, and technical patterns. Saving custom filters accelerates regular trading opportunity searches across global markets.
Heat maps visualize overall market conditions at a glance. Element size and color reflect capitalization and asset dynamics. The tool proves useful for quick market sentiment assessment in stocks or cryptocurrencies.
Social Features and Community
Trading idea publication forms the foundation of social interaction on the platform. Traders share analysis with trade direction, targets, and stop levels indicated clearly. Rating systems highlight authors with most accurate forecasts over time.
The editor's picks section presents quality ideas that passed moderation review. Filtering by assets, timeframes, and author rating helps find relevant content efficiently. Subscribing to authors creates personalized analytics feeds.
Chats unite traders by interests and markets. General discussions, instrument-specific channels, and private conversations enable participant communication. Live streams allow broadcasting trading processes in real-time.
Broker Integration and Trading
The platform integrates with over fifty brokers for direct order placement. The trading panel below charts enables opening positions without switching to broker terminals. Market, limit, and stop orders receive full support.
Paper Trading mode provides virtual accounts for practice without risking real funds. Functionality fully replicates real trading, enabling strategy testing in actual market conditions safely.
Alerts notify about reached conditions through push notifications, email, SMS, or webhook. Condition settings include level crossings, indicator triggers, or script condition fulfillment for comprehensive monitoring.
Position synchronization displays broker open trades on platform charts visually. Order management executes by dragging stop-loss and take-profit levels directly on price charts for intuitive control.
Platform Advantages and Limitations
The key advantage lies in professional tool accessibility without software installation requirements. Cloud architecture ensures work from any device with settings and saved charts synchronization between sessions.
The social component favorably distinguishes the platform from classical terminals. Learning from experienced trader public ideas accelerates beginner professional development significantly. Community feedback helps improve personal analytical skills.
Free version limitations include quote delays for some exchanges and limits on simultaneously used indicators. Active trading may require paid tier transition or real-time data subscription purchase.
Internet connection dependency characterizes cloud services inherently. Unstable connections may cause chart update delays. Critical trading operations recommend having backup connection channels available.
Conclusion
TradingView represents a comprehensive solution for financial market technical analysis. Combining professional tools with accessible interface and social features creates a unique platform for traders at any preparation level. To consolidate this material, also study technical charts.
Effective platform usage requires gradual feature mastery over time. Start with basic graphical analysis tools, then progress to indicators and screeners. Learning Pine Script opens possibilities for creating custom trading systems tailored to individual needs.
Frequently Asked Questions About TradingView
TradingView is a cloud-based platform for charting, technical analysis, and sharing trading ideas. It provides real-time exchange data, hundreds of indicators, and a social trading community.
Yes, basic version is free with charts, indicators, watchlists, and idea publishing. Paid plans remove limitations on indicators, alerts, and charts.
Pine Script is TradingView's programming language for creating custom indicators and trading strategies with backtesting capabilities on historical data.
Yes, TradingView integrates with over 50 brokers for direct order placement. Paper trading mode is also available for practice.
Stocks, forex, crypto, futures, indices, bonds, and commodities with 100,000+ instruments from global exchanges are available.
About the Author
Author: Igor Arapov — independent researcher in trading psychology and behavioral finance, practising trader since 2013, founder of arapov.trade, author of a trading book series (Open Library ), (ORCID: 0009-0003-0430-778X ).