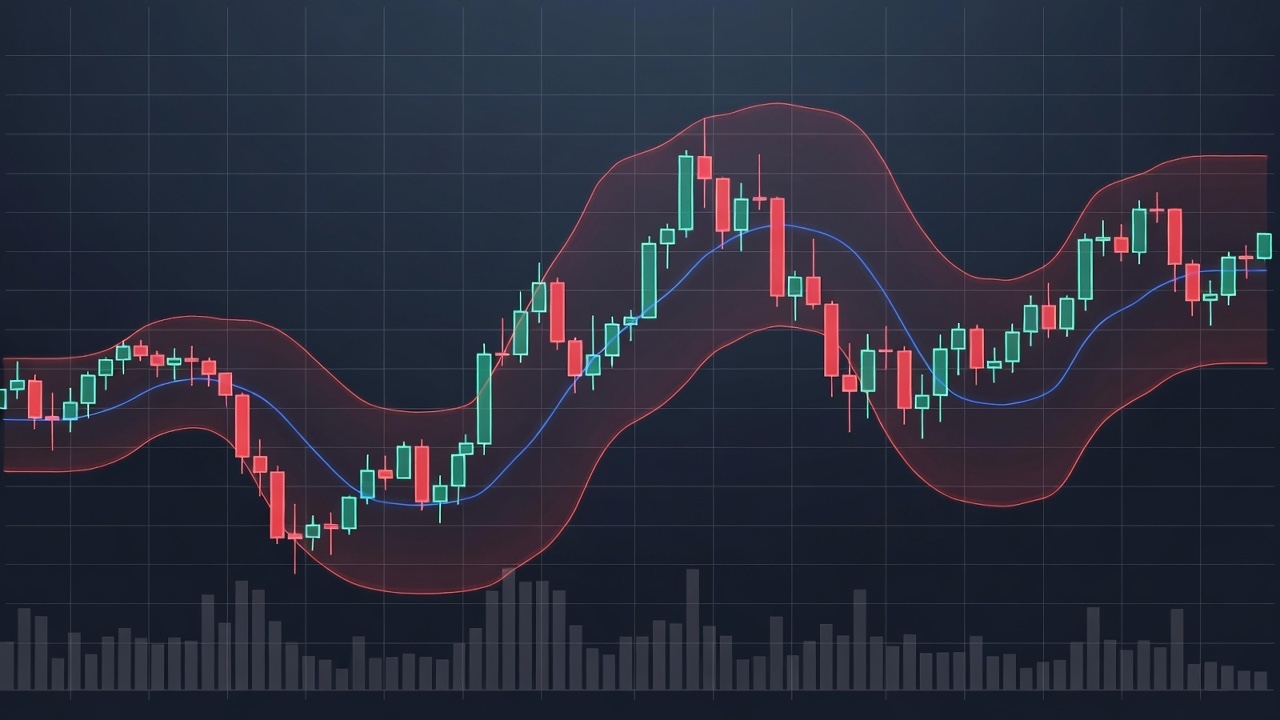
Bollinger Bands is one of the most popular and versatile technical analysis indicators, developed by American financial analyst John Bollinger in the early 1980s. The indicator measures market volatility and determines relative overbought and oversold levels.
The uniqueness of Bollinger Bands lies in their adaptability: unlike static indicators, they automatically expand during volatility increases and contract during decreases. This makes them an effective tool for any market conditions — from calm consolidations to powerful trending movements.
Structure and Calculation Formula
The indicator consists of three lines forming a channel around price. The middle band is a simple moving average (SMA), typically with period 20. It reflects the average price over the selected period and serves as the base for calculating other components.
The upper band is calculated as the middle line plus two standard deviations: Upper Band = SMA(20) + 2 × StdDev. The lower band is the middle minus two standard deviations: Lower Band = SMA(20) - 2 × StdDev.
Standard deviation is a statistical measure showing price dispersion relative to the average value. With default settings, approximately 95% of price movements fall between the upper and lower bands. Moves beyond the bands are statistically rare and signal extreme conditions.
Indicator Settings
Standard parameters — period 20 and deviation multiplier 2 — are recommended by John Bollinger himself and suit most markets and timeframes. These settings provide balance between indicator sensitivity and signal reliability.
For short-term trading and scalping, reduced period of 10 or 12 is used. This makes bands more sensitive to price changes, generating more signals. However, false triggers increase, requiring additional filtering.
For position trading, increased period of 50 or even 200 is applied. Such settings smooth short-term noise and show more significant levels. Deviation multiplier of 2.5 or 3 creates wider channel with rare but more reliable signals on band touches.
Band Squeeze: Signal of Upcoming Movement
Squeeze is one of the most important Bollinger Bands states. It occurs when volatility drops to minimum values, and bands narrow, forming a tight corridor around price.
Squeeze is a period of market energy accumulation. Like a compressed spring, the market prepares for a sharp movement. Statistically, a period of low volatility is followed by high volatility. Traders use squeeze to prepare for entry in the direction of the future breakout.
Important to understand: squeeze doesn't predict movement direction, only the fact of upcoming impulse. Additional tools are needed to determine direction: trend analysis on higher timeframe, volumes, other indicators, or Price Action patterns.
Squeeze identification can be done visually or through the Bollinger Band Width indicator. Minimum width values over the past 6 months or year indicate significant squeeze with high potential for subsequent movement.
Band Expansion and Trending Movements
Band expansion occurs during volatility growth and usually accompanies trending movements. After breaking out from squeeze, bands quickly diverge, visually confirming impulse start. The stronger the expansion, the more powerful the current movement.
In a strong uptrend, price moves in the upper half of the channel, periodically touching or breaking through the upper band. This phenomenon is called "Walking the Band" and indicates sustained bullish momentum. Attempting to short on upper band touch in such conditions is unprofitable.
Similarly, in a downtrend, price stays in the lower half of the channel. Lower band touches are not a buy signal but confirmation of bear strength. Only price exit into the upper half of the channel with middle line breakout signals weakening seller pressure.
Middle Line as Dynamic Level
The Bollinger Bands middle line is the moving average SMA(20), acting as dynamic support or resistance level. In an uptrend, pullbacks often end at the middle line, providing opportunities for long entry.
In a downtrend, the middle line works as resistance. Rally attempts are rejected from it, and price returns to downward movement. Middle line breakout with consolidation is the first sign of potential trend change or deeper correction beginning.
In a sideways market, price fluctuates around the middle line without clear direction. Middle line crossings have no special significance in such conditions. Traders wait for consolidation exit with band expansion to determine new direction.
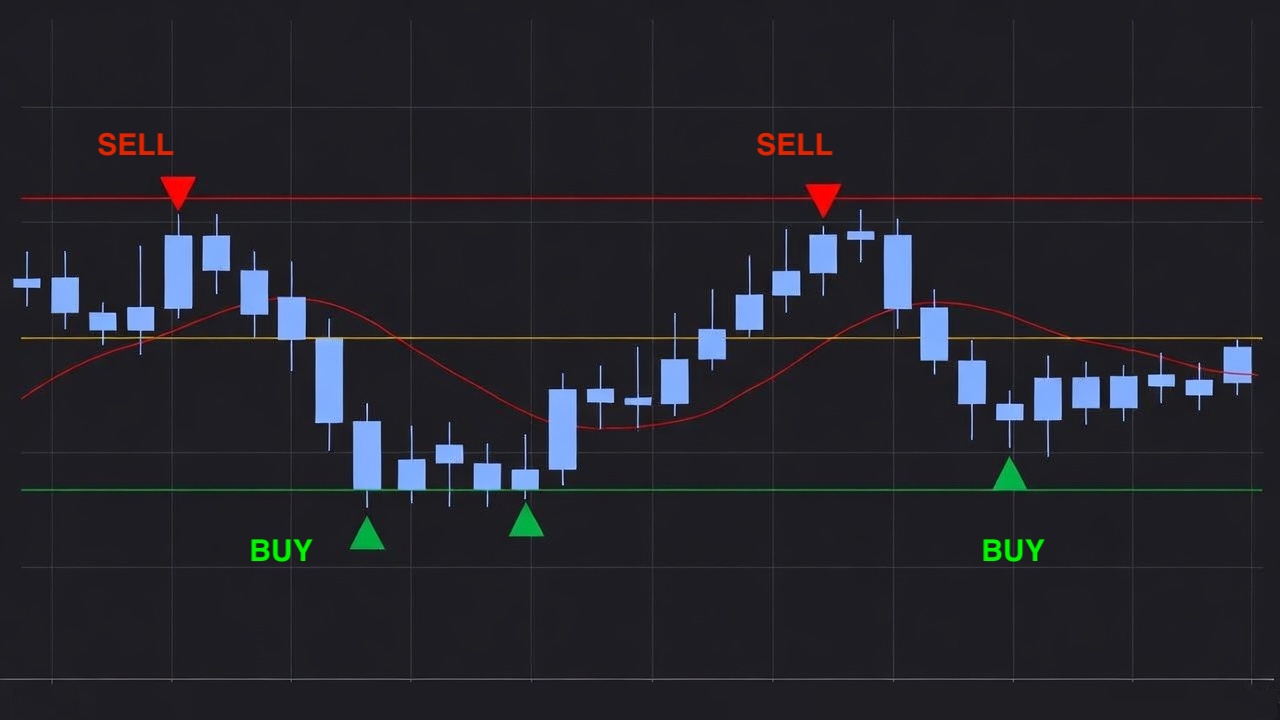
Bounce Strategy
The bounce strategy works in sideways markets and consolidations. The principle is simple: buy on lower band touch, sell on upper band touch. Target is the opposite band or middle line. Stop-loss is placed beyond the band with buffer.
Critically important to apply this strategy only in appropriate market conditions. In a trending market, buying at the lower band in a downward movement will lead to a series of losses. Confirming absence of pronounced trend is necessary before using the strategy.
Additional filters improve strategy effectiveness: reversal candlestick patterns on band touch, oscillator divergences, volume reaction. Entry is executed not on the touch itself but after confirming signal appears.
Breakout Strategy
Breakout strategy applies after band squeeze. Trader waits for price exit beyond the narrowed channel and enters in breakout direction. This is a momentum strategy based on impulse movement continuation.
Breakout confirmation includes: candle close beyond the band, volume increase, band expansion. False breakouts are common, so many traders wait for retest of the broken band before entry.
Stop-loss is set on the opposite side of squeeze or beyond the middle line. Targets are determined by support and resistance levels , Fibonacci extensions, or fixed risk-to-reward ratio.
Bollinger Bands and Double Tops/Bottoms
John Bollinger developed a specific methodology for identifying reversal patterns using his indicator. M-Top (double top) and W-Bottom (double bottom) patterns gain additional significance in the context of the bands.
Classic W-Bottom: first low touches or breaks the lower band, second low is higher than the first and stays inside the bands. This indicates weakening bearish pressure and potential upward reversal. Intermediate high breakout confirms the pattern.
M-Top forms mirror-like: first high touches the upper band, second high is lower and stays inside the channel. Bullish momentum weakens despite attempt to make new high. Intermediate low breakout activates the bearish scenario.
Combination with Other Indicators
Bollinger Bands effectively combine with oscillators. RSI helps determine if band touch is a true extreme. Lower band touch with RSI below 30 is a stronger oversold signal than touch with RSI in neutral zone.
Combination with MACD adds a trend filter. Buy signals from Bollinger Bands in ranging market are accepted only with positive MACD histogram or bullish crossover. This reduces probability of entering against forming trend. I also recommend studying the ATR indicator for a complete picture.
Pairing with Stochastic is especially useful for bounce strategy. Band touch with oversold/overbought Stochastic turning around is a high-probability entry point. Stochastic divergences at bands strengthen the signal.
Bollinger Bands Across Different Timeframes
Multi-timeframe analysis improves trading decision quality. On weekly chart, bands show long-term volatility boundaries and key zones. Squeeze on weekly timeframe precedes multi-month movements.
Daily chart is the main working tool for most traders. Band signals here have good balance between frequency and reliability. Daily chart squeezes indicate upcoming movements lasting from several days to weeks.
Intraday timeframes require caution. False signals increase, especially on minute charts. Effective approach: use higher timeframe for direction determination, lower for precise entry on band touch.
Bollinger Bands in Cryptocurrency Trading
Cryptocurrency markets are characterized by heightened volatility, affecting indicator behavior. Standard settings may give too many band touches. Increasing multiplier to 2.5 or 3 adapts indicator to crypto market specifics.
Squeezes on cryptocurrencies often precede extreme movements. Breakout after prolonged squeeze on Bitcoin or altcoins can lead to movement of tens of percent. This creates excellent opportunities for trend trading.
Bounce strategy on cryptocurrencies requires special caution. High volatility means price can break through band and continue movement without reversal. Strict stop-losses are mandatory for capital protection.
Common Mistakes Using Bollinger Bands
The main mistake is perceiving band touch as automatic entry signal. Upper band touch doesn't mean you should sell, lower band touch doesn't mean you should buy. In a trend, price can move along the band for extended periods.
Ignoring market context leads to losses. Bounce strategy in trending market, breakout strategy in ranging market — typical mistakes. Determining current market regime should precede trading tactics choice.
Lack of confirmation reduces signal quality. Bollinger Bands is not a self-sufficient tool. Combining with volume analysis, candlestick patterns, and the ability to use different trading indicators is critically important for profitable trading.
Bollinger Bands and Smart Money
In the context of Smart Money concept, Bollinger Bands squeeze often corresponds to accumulation or distribution phases. Large players build positions during low volatility periods before initiating movement.
False band breakouts can be used by Smart Money for liquidity grabbing. Price exits beyond band, triggers retail trader stop-losses, then sharply reverses. Understanding this mechanics helps avoid traps.
Band expansion after squeeze with high volume indicates large capital entry. This is the moment when Smart Money reveal their positions and begin aggressively moving price. Joining such movement is optimal tactics.
Percent B and Bandwidth
Percent B (%B) is a derivative indicator showing price position relative to bands. Value 0 means price is at lower band, 1 at upper band, 0.5 at middle line. Values above 1 or below 0 indicate exit beyond bands.
%B is useful for quantitative assessment of price position in channel. Traders can create rules based on specific values: for example, buy when %B below 0.1, sell when %B above 0.9. This adds objectivity to decision making.
Bandwidth measures distance between upper and lower bands relative to middle. Low width values signal squeeze, high values signal expansion. Historical width minimums often precede significant movements.
Psychological Aspects of Trading
Bollinger Bands help objectify price perception. Visual channel boundaries show whether current price is relatively high or low compared to recent history. This reduces emotional trading decisions.
However, FOMO can arise when watching breakouts. Trader sees sharp movement after squeeze and enters late, when significant part of impulse is already realized. Disciplined setup waiting is key to success.
Patience during squeeze is crucial quality. Consolidation can continue long, provoking premature entries. Clear breakout criteria and willingness to miss first movement in favor of retest protect from false triggers.
Backtesting Strategies
Testing on historical data is mandatory before applying any Bollinger Bands strategy. The indicator is easily programmable, allowing automated verification of various settings and entry/exit rules.
When backtesting, it's important to test across different market conditions: trends, ranges, periods of high and low volatility. Strategy working only in certain conditions requires reliable filter for identifying appropriate market regime.
Over-optimization is a typical trap. Perfectly fitted parameters for historical data rarely work in live trading. Robust strategy shows acceptable results with various reasonable indicator settings.
Conclusion
Bollinger Bands remain one of the fundamental technical analysis tools thanks to their adaptability and versatility. The ability to automatically adjust to current volatility makes the indicator applicable in any market conditions and on any assets.
The key to successful Bollinger Bands use is understanding their nature and limitations. The indicator doesn't generate ready trading signals but provides context for decision making. Combining with trend analysis, volumes, and other tools, clear market regime determination, and disciplined risk management rule following transform Bollinger Bands into a powerful element of profitable trading system. Beginner traders are recommended to master basic concepts on demo account before transitioning to real funds.
Frequently Asked Questions
Bollinger Bands is a volatility indicator consisting of three lines: the middle band (SMA 20), upper and lower bands positioned two standard deviations from the middle. Developed by John Bollinger in the 1980s.
Standard settings: SMA period — 20, standard deviation multiplier — 2. For short-term trading use period 10, for long-term — 50. Multiplier 2.5-3 for less frequent signals.
Squeeze occurs when bands narrow to minimum values, indicating low volatility. This signals an upcoming strong price movement, although breakout direction is unknown in advance.
In sideways markets, price bounces from upper and lower bands. Buy on lower band touch with confirmation, sell on upper band touch. Stop-loss beyond the band, target — middle line or opposite band.
Yes, bands act as dynamic support and resistance levels. The middle line often serves as support in uptrends and resistance in downtrends. However, in strong trends price can walk along the band.
About the Author
Author: Igor Arapov — independent researcher in trading psychology and behavioral finance, practising trader since 2013, founder of arapov.trade, author of a trading book series (Open Library ), (ORCID: 0009-0003-0430-778X ).