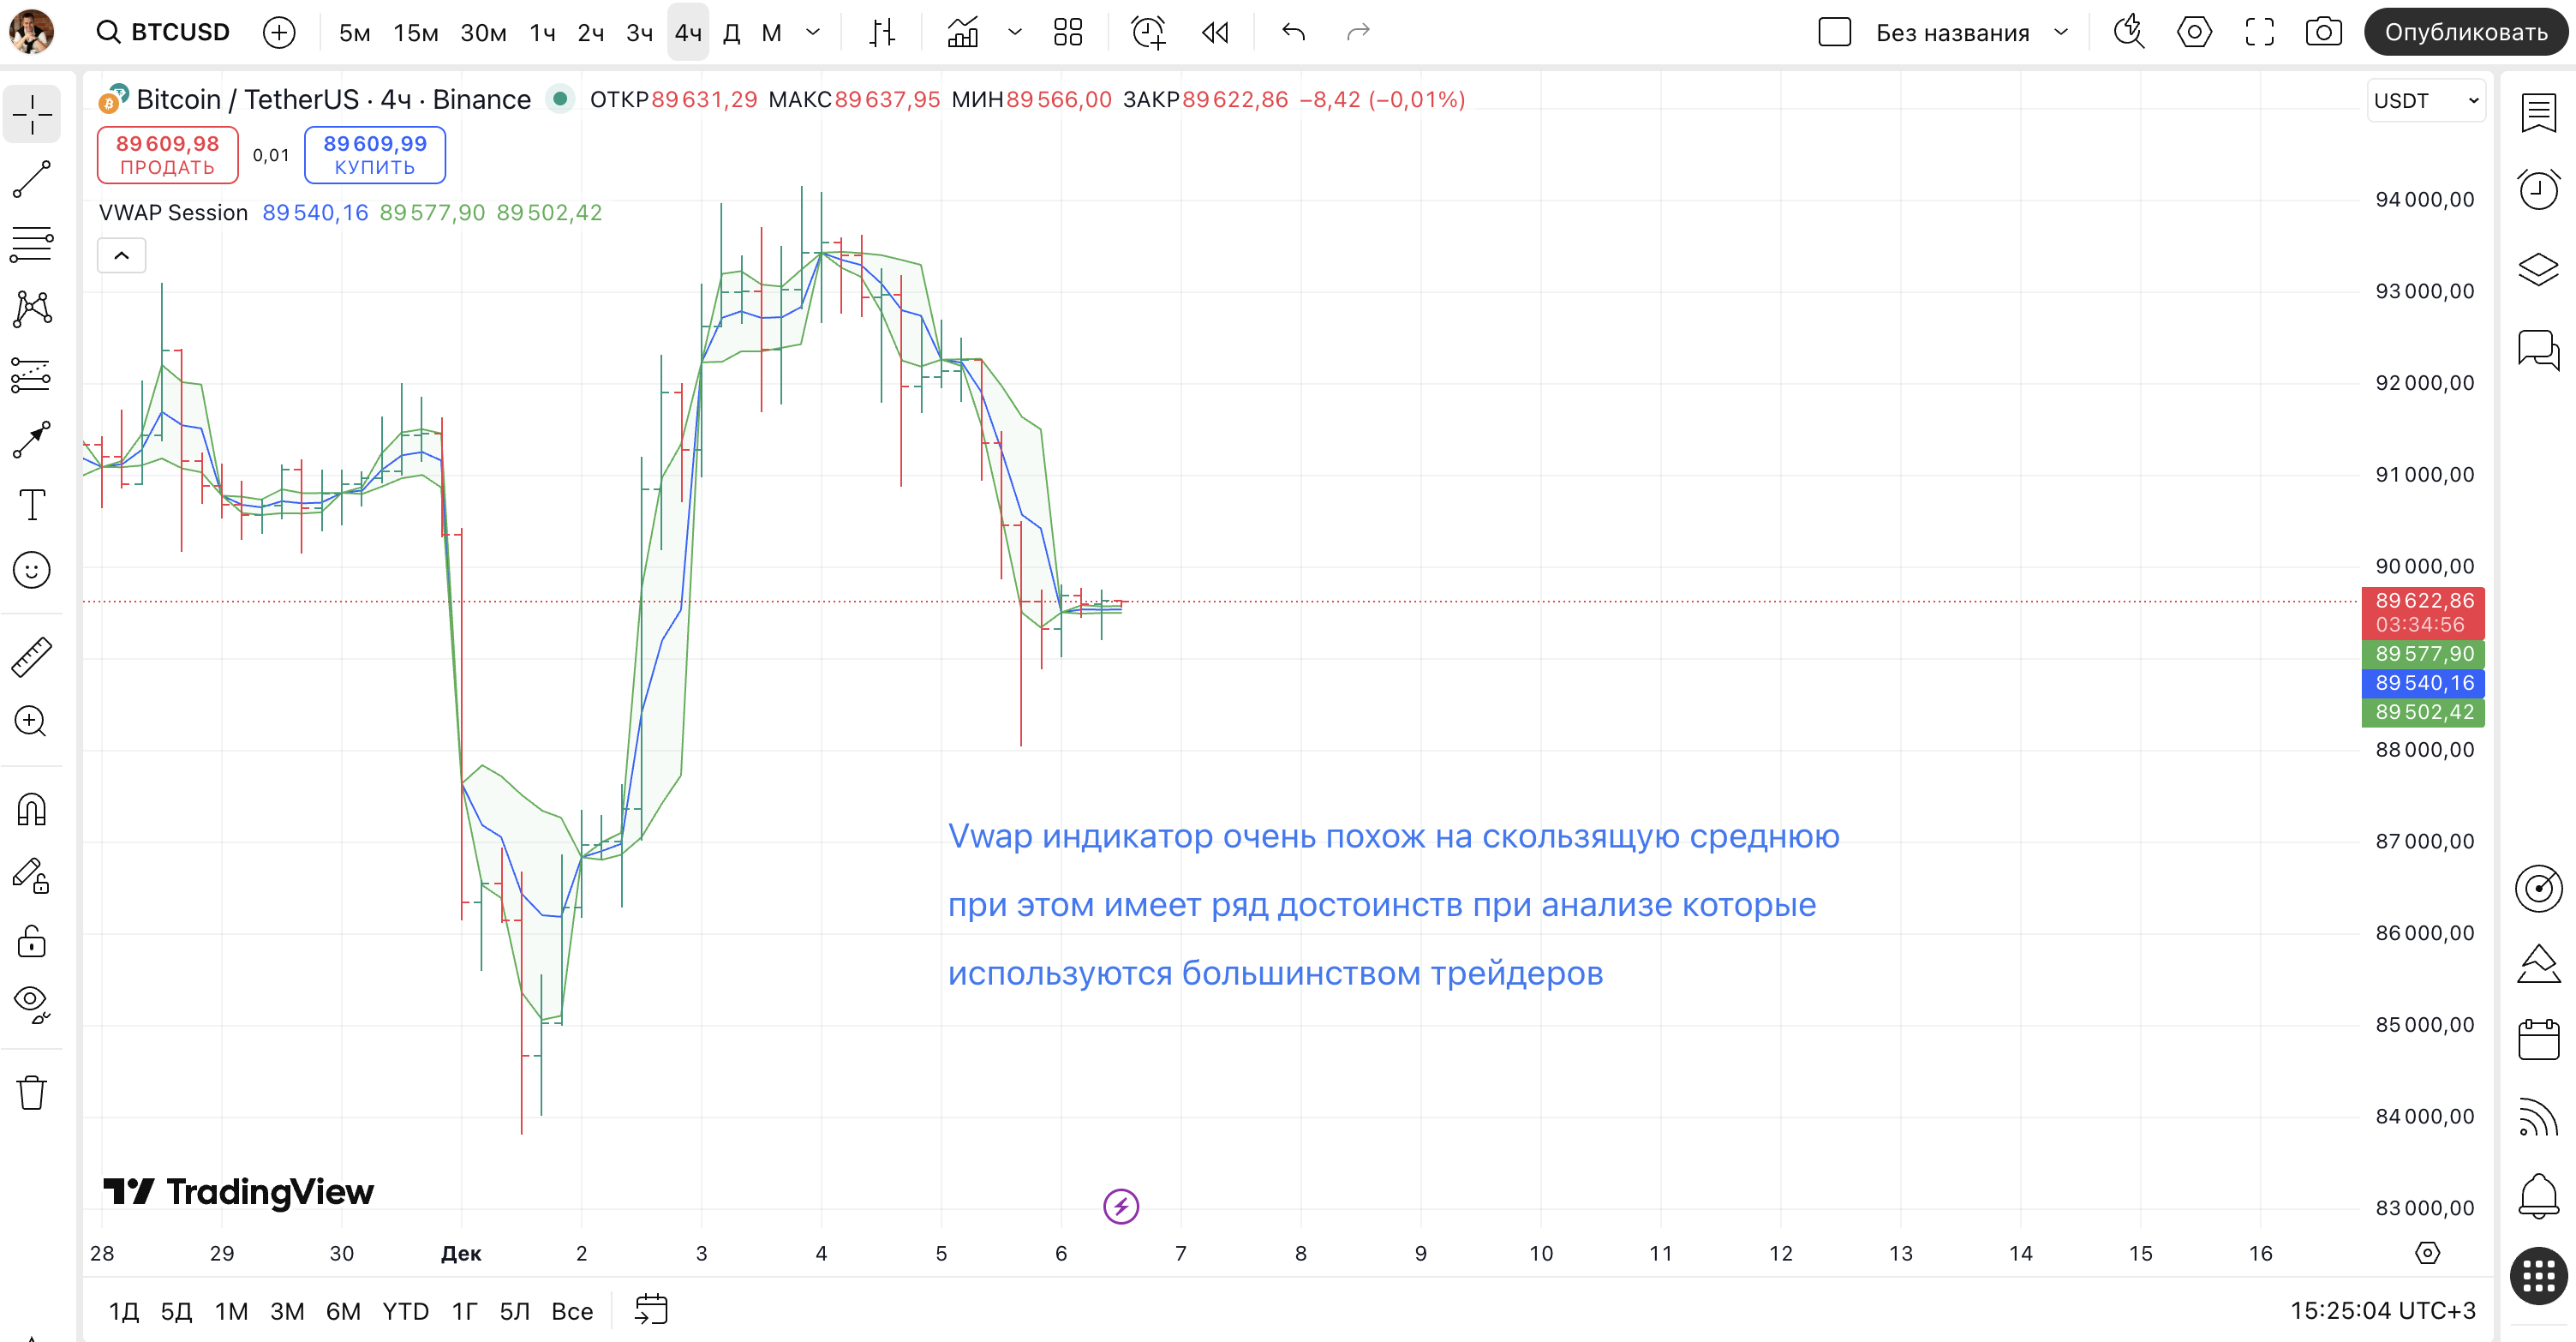
VWAP — Volume Weighted Average Price — stands as one of the most important indicators for intraday traders. Unlike simple moving averages treating all prices equally, VWAP weights price by volume, revealing the true average price paid by market participants. Understanding VWAP provides insight into institutional activity and execution quality.
Originally developed for institutional execution analysis, VWAP now serves retail traders as powerful support/resistance indicator. Its objectivity and universal application make it essential tool for day traders across all liquid markets. Price relationship to VWAP indicates whether buyers or sellers control the session. To understand this topic more deeply, I recommend studying technical indicators .
Calculation Methodology
Typical Price forms VWAP's foundation: (High + Low + Close) / 3 for each period. This three-point average represents consensus price for each candle more accurately than close alone. Read more about this in the article How to analyze trading volume .
VWAP equals cumulative (Typical Price multiplied by Volume) divided by Cumulative Volume. Each new bar updates numerator and denominator, producing running weighted average. Early session VWAP moves quickly; late session VWAP stabilizes as denominator grows.
Session VWAP resets at each session open, starting calculation fresh. This daily reset makes VWAP purely intraday indicator for standard application. Extended session trading complicates interpretation.
Institutional Application
Institutions use VWAP as execution benchmark. Traders filling large orders aim to execute at or better than VWAP. Buying below VWAP indicates superior execution; selling above VWAP demonstrates skill. This benchmark drives enormous institutional flow toward VWAP.
Algorithmic execution strategies slice large orders throughout session targeting VWAP. This activity creates self-fulfilling support and resistance as algorithms buy dips to VWAP and sell rallies to it. Understanding this dynamic explains VWAP's effectiveness.
Performance measurement against VWAP determines trader compensation at institutions. This high-stakes incentive ensures VWAP remains focal point for professional execution. Retail traders benefit from understanding this institutional focus.
Trend Identification
Price above VWAP indicates bullish session control. Buyers paying above average price demonstrate willingness to accumulate. Sustained trading above VWAP confirms uptrend continuation. Pullbacks to VWAP offer buying opportunities in bullish context.
Price below VWAP signals bearish session control. Sellers accepting below-average prices indicate distribution. Sustained trading below VWAP confirms downtrend. Rallies to VWAP offer selling opportunities in bearish context.
Price oscillating around VWAP suggests balanced session without clear directional control. Range-bound conditions prevail until price establishes clear relationship. Breakouts from VWAP consolidation often initiate directional moves.
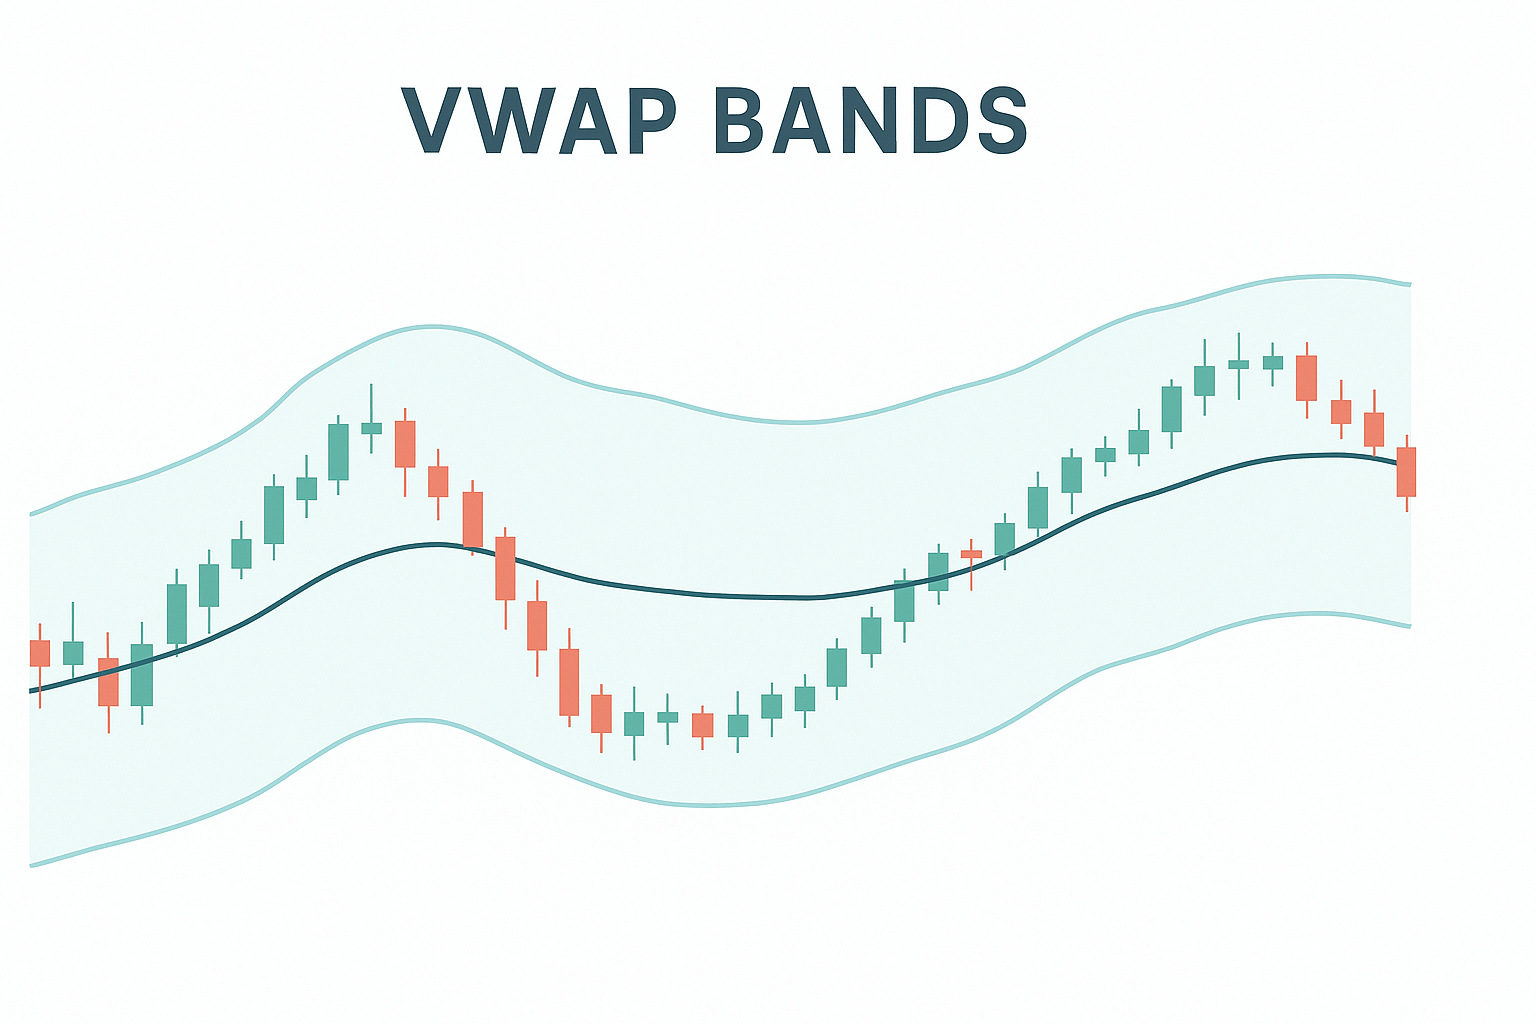
Standard Deviation Bands
VWAP Bands add standard deviation envelopes around VWAP. First standard deviation band contains approximately 68% of price action. Second band contains 95%. These create objective overbought/oversold zones relative to session average.
Price reaching upper band suggests extended conditions relative to VWAP. Mean reversion traders fade moves to bands anticipating return to VWAP. Strong trends, however, can ride bands without reverting.
Band touches provide profit targets for VWAP entries. Long positions from VWAP target upper band. Short positions target lower band. Defined targets enable systematic trade management.
Anchored VWAP
Anchored VWAP allows starting calculation from any significant point rather than session open. Earnings announcements, major highs/lows, news events — anchoring VWAP to these points reveals average price from that catalyst.
Swing traders use anchored VWAP from significant pivot points. This creates relevant support/resistance extending across multiple sessions. Participants who entered at the anchor point average into their positions around anchored VWAP.
Multiple anchored VWAPs from different points create confluence zones. Price levels where several anchored VWAPs converge represent significant support or resistance areas.
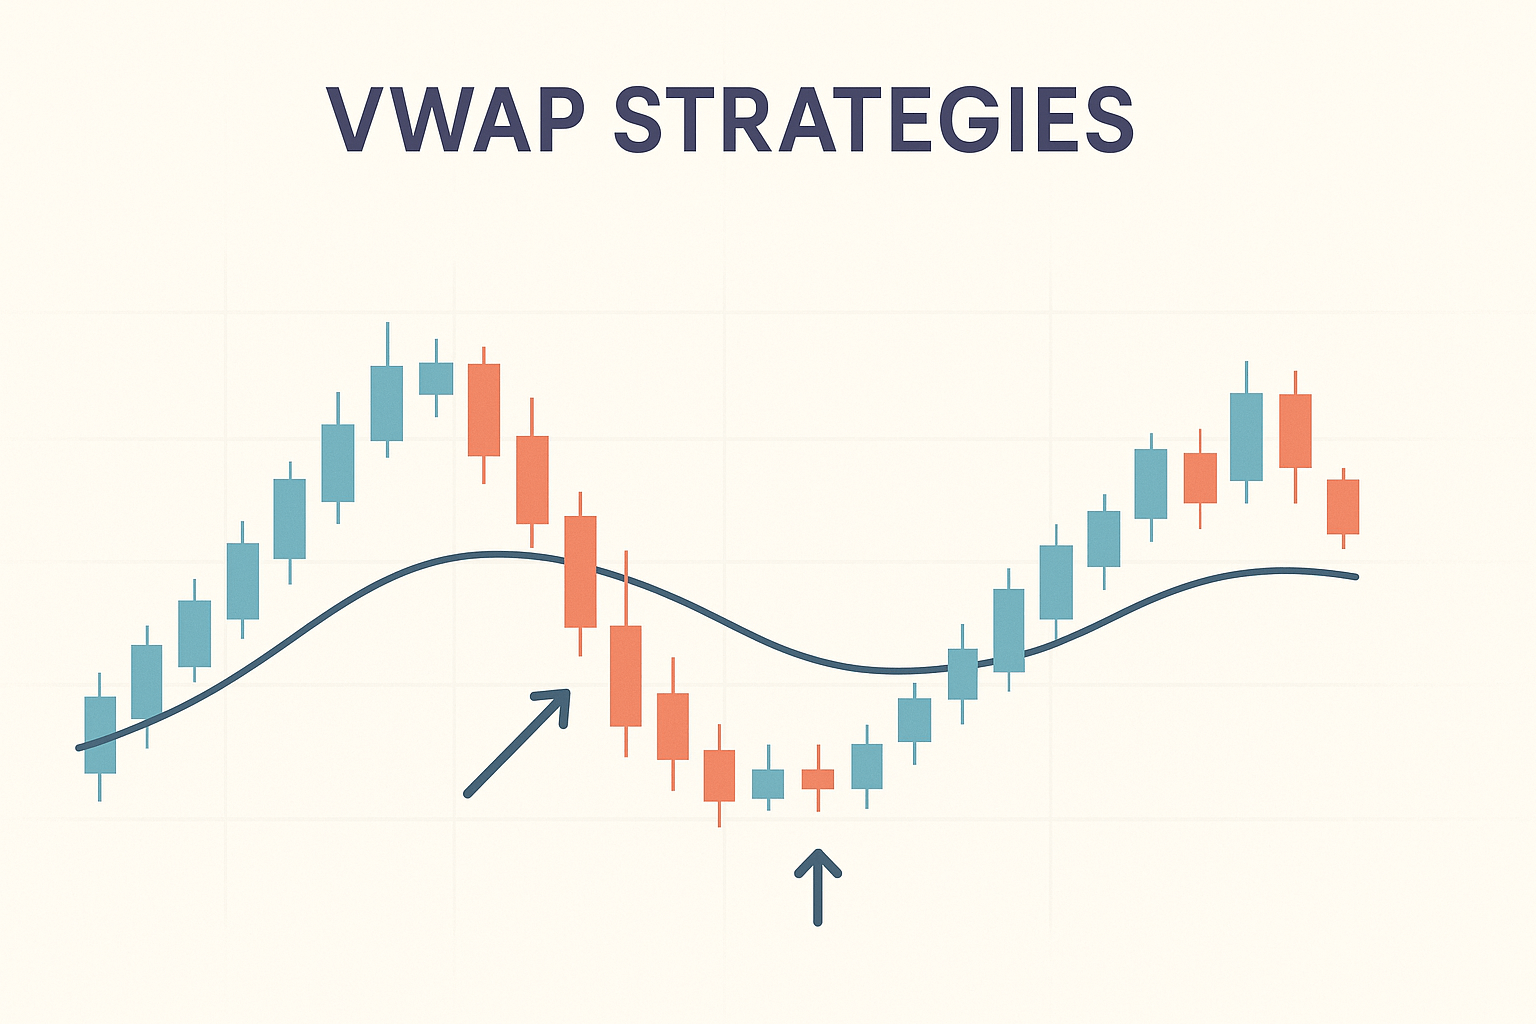
Trading Strategies
VWAP pullback strategy buys dips to VWAP in bullish sessions. After price establishes above VWAP, wait for retest. Enter long at VWAP touch with stop below. Target previous high or upper band.
VWAP breakdown strategy shorts rallies to VWAP in bearish sessions. After price establishes below VWAP, wait for rally. Enter short at VWAP test with stop above. Target previous low or lower band. In addition to this, it is useful to understand Steidlmayer analysis.
Opening range breakout with VWAP confirmation adds filter. Breakout above opening range with price above VWAP confirms bullish. Breakdown below range with price below VWAP confirms bearish.
Volume Profile Integration
Volume Profile complements VWAP by showing volume distribution across price levels. High volume nodes represent acceptance zones where significant trading occurred. Low volume nodes suggest rejection zones price moves through quickly.
VWAP near volume profile high-volume node creates powerful support/resistance confluence. Both indicators pointing to same level increases significance. Confluence zones warrant larger position sizes.
Limitations
VWAP works best in liquid markets with consistent volume. Thin markets produce erratic VWAP behavior less useful for trading. Focus VWAP application on liquid instruments.
Early session VWAP remains volatile as limited data drives calculation. Wait for VWAP to stabilize, typically 30-60 minutes into session, before relying heavily on its levels.
Strong trending days can see price never return to VWAP. Waiting for pullback misses entire move. Recognizing momentum conditions prevents over-reliance on VWAP entries.
Practical Application
Begin each session noting opening price relative to previous VWAP. Gap above suggests bullish continuation. Gap below indicates bearish pressure. First hour establishes session character around VWAP.
Track how price responds to VWAP tests. Clean bounces or rejections indicate respect. Messy chop around VWAP suggests indecision. Price response quality guides position sizing.
Combine VWAP with price action confirmation. Candlestick patterns at VWAP tests provide timing signals. Support/resistance confluence with VWAP increases level significance.
Conclusion
VWAP stands far beyond a simple technical indicator—it represents a window into institutional market behavior and logic. Volume-weighted average price reveals the true average price paid by market participants, accounting for real trading activity. Understanding this mechanism grants retail traders a competitive edge in identifying significant levels and forecasting price movement.
The connection between VWAP and the Smart Money concept proves particularly critical. Institutional traders organize their large orders around VWAP, using it as an execution quality benchmark. Retail traders who understand this logic can trade in harmony with major players rather than against them. Accumulation below VWAP and distribution above—this standard Smart Money pattern reveals itself through price movement and volume dynamics.
Integration of VWAP with standard deviation bands creates a powerful risk management system. Upper band touches in bullish sessions provide objective profit targets. Lower band touches in bearish sessions define exit points. Anchored VWAP extends the tool beyond intraday trading, allowing swing traders to track the average price of major institutional entries across weeks and months.
However, VWAP is not a holy grail. It performs best in liquid markets, requires time to stabilize at session open, and can lag during strong trends. Strong trending days often see price never returning to VWAP. Recognizing trading regimes and adapting your strategy to market conditions remains essential for success.
Combine VWAP with volume analysis and Price Action for maximum effectiveness. High volatility at VWAP touches signals institutional defense of price levels. Low volatility suggests potential breakouts. Practice on demo accounts until mastery, recognize session quality, and maintain unwavering trading discipline.
VWAP awaits disciplined traders who respect institutional logic and use it as a compass for navigating the market. Your dedication to understanding this indicator will unlock doors to consistent and profitable trading.
Frequently Asked Questions
VWAP is Volume Weighted Average Price - the average price weighted by volume throughout trading session. It shows true average price paid by market participants.
VWAP equals cumulative (Typical Price x Volume) divided by cumulative Volume. Typical Price is (High + Low + Close) / 3. Resets at session start.
Institutions benchmark execution against VWAP. Buying below VWAP or selling above indicates favorable execution versus market average price.
Price above VWAP indicates bullish bias. Below VWAP signals bearish. Pullbacks to VWAP in trends offer entry opportunities with defined risk.
Standard deviation bands around VWAP create overbought/oversold zones. First band captures 68% of price action, second band 95%.
About the Author
Author: Igor Arapov — independent researcher in trading psychology and behavioral finance, practising trader since 2013, founder of arapov.trade, author of a trading book series (Open Library ), (ORCID: 0009-0003-0430-778X ).