How to read price action, identify levels, and assess candlestick and chart patterns.
Short answers based on the ArapovTrade library. Each answer links to a detailed explanation. Trading approaches are presented as Igor Arapov's explanations; first-person wording refers to the author.
Reading Price Charts Step by Step
What is technical analysis based on?
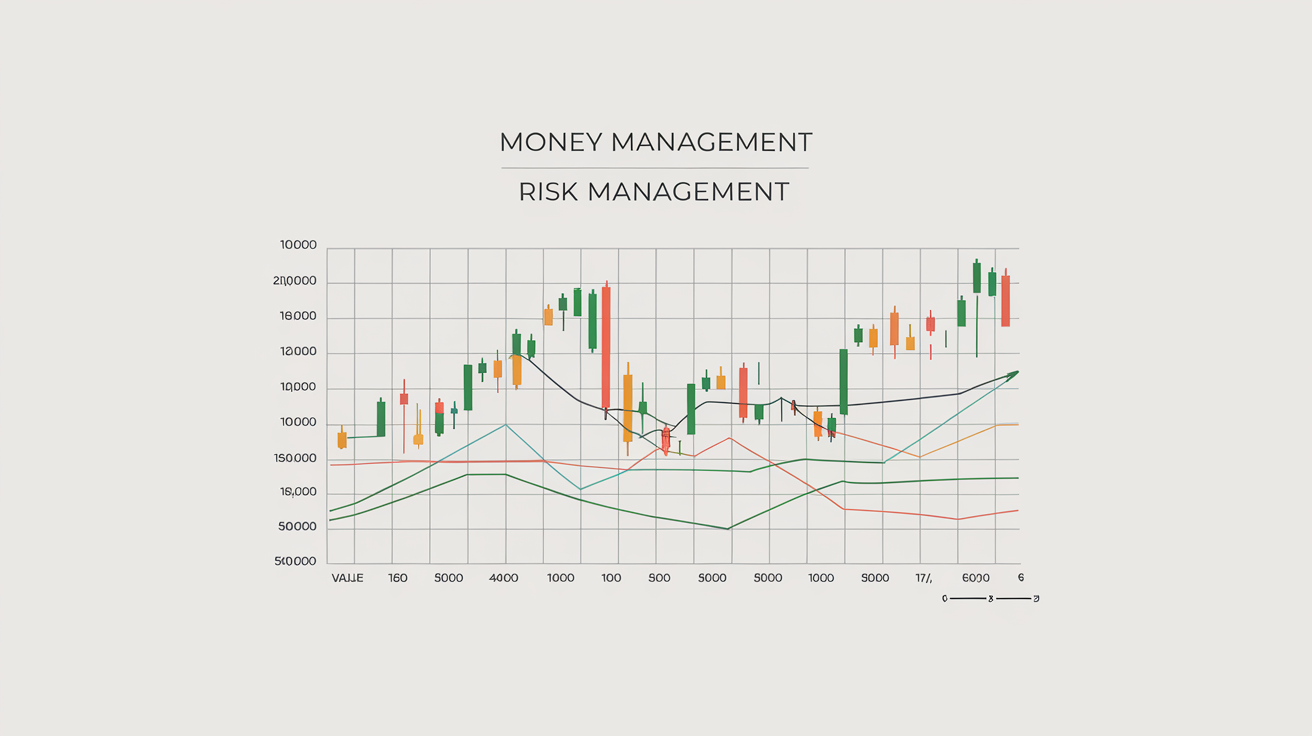
Technical analysis reads the market by price and volume, on the premise that all the information is already in price; the most objective thing in it is a level, which everyone sees the same way, while patterns and indicators are far more subjective.
How do line, bar and candlestick charts differ?
A trading chart can be a line, a bar or a candlestick: the line shows only the close and suits the big picture, while the bar and the candle carry the full price data for the period, open, high, low and close.
What information do bars and Japanese candlesticks share?
A bar and a candle carry the same four prices, open, high, low and close, only the candle adds a coloured body and reads at a glance; but a lone candle on its own is roughly even odds, and it gains meaning only at a zone with volume.
What is a timeframe, and which periods does the author suggest for beginners?
A timeframe sets how much time one candle holds, from a minute to a week, and at the same time outlines your style; a beginner is steadier on the higher periods, the hour and the day, where noise is quieter, analysis is roomier and the spread eats less.
How does the author combine higher and lower timeframes?
The higher timeframe always outranks the lower: it sets the direction, the lower one is only for entering in that direction, so I go top down, from the trend and zones on the higher chart to the entry point on the lower.
How does ArapovTrade describe trends, ranges and market balance?
The market is always in one of three phases: up trend, down trend or range; a range is balance and a price box of accumulation or distribution, a trend is imbalance, and which box is in front of you is told by volume; decide the phase first, then pick the tool.
Why does the author draw support and resistance as zones?
A level is a zone where price reversed before, support below, resistance above, and they work on the market's memory; build it as a range across several touches and confirm it with volume, do not drag a line along the peak.
How does the author trade between levels and assess false breakouts?
The base strategy is buying at support with a target at resistance and the reverse, with the stop just beyond the zone and an entry on the reaction; a real breakout runs on raised volume and settles, a false break is sluggish and comes straight back, so wait for the retest.
How are trend channels drawn and used in the author's method?
A channel is a zone between two parallel lines, and the slope splits them into ascending, descending and horizontal; you build it from real points and do not stretch it to an idea, and an entry I take not off a touch but on the reaction and volume.
How do impulses, pullbacks and structure changes affect a trading scenario?
A trend is made of impulses on volume and pullbacks without it; while highs and lows keep updating the structure holds and I go with the trend, while a break of structure shows the auction has changed. An honest reversal is given away by three signs in a row, the false break, the level break and the retest, and I confirm all three with rising volume.
Why does the author prioritize levels and volume over chart patterns?
Patterns are worth knowing by sight, but as a signal they come out roughly fifty-fifty, because everyone sees them and the big player harvests liquidity off them; indicators lag, so a level and volume are more reliable, and from the patterns I take only the flag, for the target projection.
How does volume analysis complement chart reading?
Chart reading is the foundation, but a level only tells you where to look for a trade while volume confirms whether the interest is real; once I added volume analysis to clean levels, the quality of my decisions rose noticeably.
How to Trade Breakouts
What is a breakout in trading?
A breakout is price passing through a zone it could not clear before, but stepping past the level proves nothing on its own: big money often sweeps stops with a fake move first, and a level is a zone, not a line.
How does the author use volume to assess a breakout or fakeout?
A real breakout comes with rising volume, a fakeout lacks it: effort past the level with no volume and no hold is the first sign of a fake, which is why volume is my main filter.
How does the author interpret failed breakouts as liquidity grabs?
A big player needs opposing orders, so he drives price past the level where the crowd holds stops and loads up against them before reversing the market: a fakeout is not bad luck, it is an engineered trap.
Why does the author wait for a retest instead of entering the first break?
You enter on the retest, not the break: wait for the pullback to the broken level and a pin bar on rising volume, then work in the breakout's direction; on a fakeout it is the same, but you enter against the crowd that got swept.
How does the author set the stop and target for a breakout setup?
Stop beyond the extreme of the pullback or the false break plus a buffer, target on the next impulse level; I take only trades from 1 to 2, ideally 1 to 3, and I do the opposite of instinct: I wait for the retest instead of jumping into the break.
How to Read Japanese Candlestick Patterns
What price information does a Japanese candlestick contain?
A candle holds four prices for its period; a large body means one side dominated, long wicks mean levels were refused, and the close matters most because it shows who stayed in charge.
How do bullish and bearish candles differ?
Close above the open is bullish, below is bearish, colour is secondary; but a large body on weak volume is a hollow shell, only volume gives a candle real force.
What is a pin bar, and how does the author assess it at a level?
A pin bar is a long wick with a small body, the trace of a level being rejected: the wick runs two to three times the body, a bullish one with a lower wick exposes weak sellers, a bearish one weak buyers, but it works only at a level.
What is a bullish or bearish engulfing pattern?
Engulfing is two bars where the second covers the first body and closes back the other way; a large body is strong, a small one weak, and it only means something at a level, like euro futures with three touches and three bounces.
What do hammer, doji and evening-star candles describe?
A hammer is a long lower wick and a hint of a turn up, a doji is hesitation and a pause, the evening star is three candles at a top and a hint down, but all of them are a signal only at a strong level, and in empty space they are noise.
Why does the author require a level and volume before acting on a candle?
A bare candle is a coin toss split roughly evenly, the command comes from the level and the candle only fine-tunes the moment; a hammer in empty space I skip, at proven support with volume I take, because a candle is the final brushstroke, not a signal on its own.
What is a Harami pattern, and why does it not confirm a reversal on its own?
In a Harami pattern, a small candle's body lies within the preceding larger candle's body. This can indicate a pause or weakening momentum. The author looks for a subsequent range breakout and volume response rather than entering on the pattern alone.
How does a Hanging Man differ from a Hammer?
Both have a small body and a long lower shadow. A Hammer is considered after a decline, whereas a Hanging Man appears after an advance. Context and subsequent price action matter more than the pattern's name alone.
Recognizing the Most Reliable Chart Patterns
What is a chart pattern, and why can traders see patterns in noise?
A chart pattern is a shape the brain finds in the noise of price, but the market need not respect it, so it's safer to lean on levels than on the form.
How do reversal patterns differ from continuation patterns?
Reversal patterns catch the end of a trend, continuation patterns catch its pause, but read either one only with volume and on a higher timeframe, or it's just a picture.
How does the author assess a head-and-shoulders breakout?
Three peaks with the head in the centre and a neckline below, but the turn counts only on a neckline break with volume, and the first spike through is often a stop-hunt rather than a signal.
How does the author distinguish a double top or bottom from an unfinished range?
Two highs at one ceiling with a neckline break down, but while the neckline holds it's a range and not a figure, and volume decides: lower on the second peak, higher on the break.
What distinguishes ascending, descending and symmetrical triangles?
Price squeezing between converging lines with fading volume; ascending hints up, descending down, the symmetrical gives no clear direction in advance, and I take the entry on a boundary break with volume, not on the figure.
How does the author interpret flag and pennant patterns?
A flag is a sharp pole on volume plus a sluggish pullback against the trend, a pennant is the same pause as a converging triangle, and the entry is on a break with volume after the false break, not on the first spike.
What does the author look for in a cup-and-handle setup?
A rounded correction plus a short handle with an upside break, but the value sits in the handle where a false break sweeps stops, not in the contour; enter after a hold with volume, stop under the handle's low.
How does the author interpret a 1-2-3 reversal setup?
Three points on a strong level, the reversal on a break of point 2, but the entry at point 3 gives a short stop and a better ratio; behind the points sits large-capital accumulation, and volume is what tells the figure from geometry.
Why does the author avoid trading chart shapes without levels and volume?
The naked contour fills roughly evenly and gives no edge; patterns program the crowd and large capital harvests liquidity on them, so I watch the level, the false break and the volume, not the shape, and always with a stop.
What are rising and falling wedges?
Both converging boundaries of a wedge slope in the same direction. A rising wedge may indicate weakening upward movement, and a falling wedge weakening downward movement. The author evaluates the breakout and volume rather than treating the shape as a guarantee.
How to Count Elliott Waves
What is Elliott Wave Theory's basic market-cycle structure?
Elliott Wave Theory describes the market through repeating waves that reflect crowd psychology: a full cycle is eight waves, five impulse with the trend and three corrective against it, and the structure is fractal.
How are Elliott waves related to psychology and Fibonacci proportions?
Each wave has its own psychology, from the timid first to the euphoric fifth on weakening volume; there are three hard rules and Fibonacci guides (corrections of 38 to 62 percent, the third wave's target near 162), but these are probabilities, not a guarantee.
Why does the author regard Elliott wave counts as subjective?
The theory's main trouble is subjectivity: ten analysts mark one chart in different ways, and the waves are easily fitted in hindsight, so I prefer objective levels, volume, and phases by Wyckoff.
How to Draw and Use Fibonacci Levels
What are Fibonacci retracement levels used to describe?
Fibonacci marks the probable depth of a pullback, but what works is not the magic of numbers, it is the mass attention traders pay to these marks.
How does the author draw a Fibonacci retracement grid?
I drag the grid along the body of a clear impulse, from the start of the move to its end, while on small swings it only gives a mush of false levels.
How does the author interpret the 61.8% retracement zone?
The 61.8 level is the strongest, but price does not reverse exactly on the line, so I read the reaction in the zone rather than the fact of a touch.
How does the author set up a Fibonacci entry, stop and target?
A usable setup is a pullback into a Fibonacci zone that overlaps a real level, with the trend, confirmed by a reversal candle and volume; the stop goes just beyond the next level (the 78.6 when entering off the 61.8), and the target comes from structure or an extension like the 161.8.
How does the author combine Fibonacci zones with levels and volume?
A single Fibonacci line lies, so I take an entry only where it lines up with a real level and volume, keeping a reward-to-risk of at least 1 to 3.
How do Fibonacci extensions differ from retracements?
Retracement levels lie within the original move, while extensions project beyond it as possible target references. The material discusses 127.2%, 161.8%, and 261.8% without guaranteeing that price will reach them.
About the author
The library materials were prepared by Igor Arapov, a practising trader since 2013.